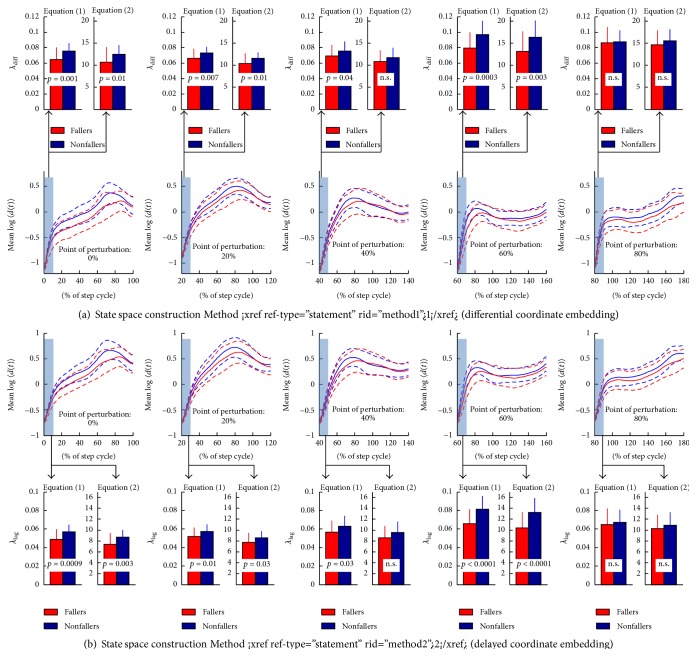
Figure 3.
(a) Mean ± 1SD of the log-median 〈d i(t)〉 for fallers (red) and nonfallers (blue) defined by the state space reconstruction Method 1 (differential coordinate embedding) for initial perturbation at 0%, 20%, 40%, 60%, and 80% of the step cycle. The smaller upper subplots show mean ± 1SD of local dynamic stability λ diff for fallers (red) and nonfallers (blue) together with p values. (b) Mean ± 1SD of the log-median 〈d i(t)〉 for fallers (red) and nonfallers (blue) defined by the state space reconstruction Method 2 (delay coordinate embedding) for initial perturbation at 0%, 20%, 40%, 60%, and 80% of the step cycle. The smaller upper subplots show mean ± 1SD of local dynamic stability λ lag for fallers (red) and nonfallers (blue) together with p values.

