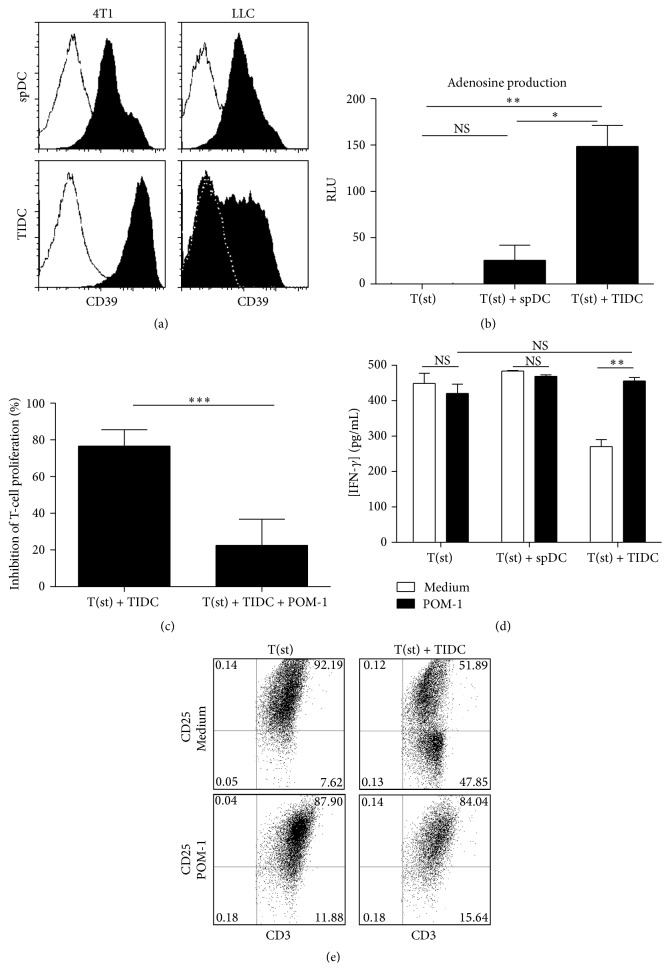
Figure 4.
TIDC inhibit T-cell response through the ectoenzyme CD39. (a) Purified spDC and TIDC (derived from 4T1 and LLC tumors) were stained for CD39. The white histograms represent the isotype controls (representative of 5 independent experiments). (b) CD3/CD28-stimulated T cells were cultured alone (T(st)), with TIDC (T(st) + TIDC), or with spDC (T(st) + spDC). After 48 hours, supernatants were collected and concentration of adenosine was determined by chemiluminescence assay kits (representative of 3 experiments). (c) Total T cells were labeled with CellTrace Violet, stimulated with CD3/CD28 beads and cultured for 5 days with TIDC in presence or absence of POM-1, the CD39 inhibitor. The proliferation index was measured and the percentage of inhibition for each condition was calculated based on the proliferation index of stimulated T cells. (d) IFN-γ concentration was quantified in the supernatant of the previous cocultures. (e) The T cells exposed to TIDC or spDC were stained for CD25 and CD3 to evaluate T-cell activation.

