Figure 2.

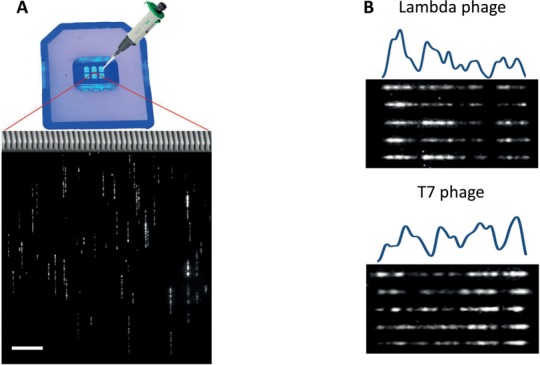
(A) On top, an image of a chip used in the experiments for stretching the labelled DNA. The chip contains three nanochannel arrays (red lines representing an enlargement of a part of the middle array). Each array has two reservoirs, an anterior and a posterior one (a cartoon of a pipette is pointing to the anterior reservoir to which the DNA is being loaded). On the bottom, an image of a field of view of the nanochannels containing stretched and labelled T7 genomes. The scale bar at the bottom left corner represents a distance of 10 μm. (B) Images of five representative λ (upper panel) and T7 (lower panel) genomes, labelled with M.TaqI and AdoYnTAMRA, and stretched in nanochannels. The molecules are aligned to each other and to the theoretical AM profile based on their similar AM profiles.
