
Figure 3.
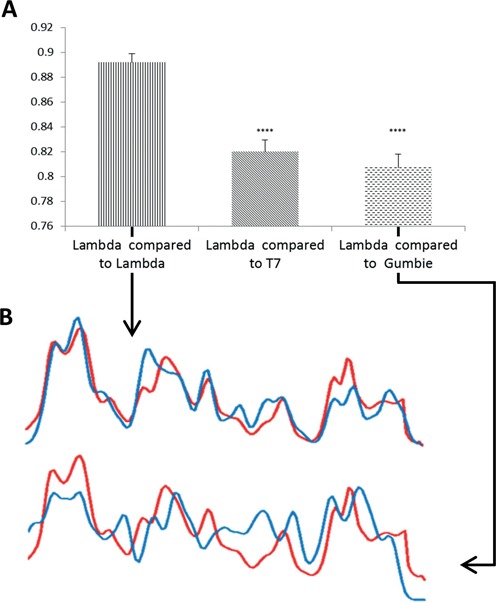
(A) AM profiles were generated from λ genomes labelled with AdoYnTAMRA using M.TaqI (27 molecules). Cross correlation was calculated between the λ genomes and theoretical profiles of λ, T7 and GUmbie phage genomes. The CC score was significantly higher when the λ genomes were compared to the theoretical AM profile of λ (P-value <0.0001 when compared to T7 and P-value <0.0002 when compared to GUmbie paired t-test). (B) AM profile extracted from an image of one representative λ genome, labelled with M.TaqI and AdoYnTAMRA, when compared to the theoretical AM profile of λ (upper plot, CC value = 0.89) and to the theoretical AM profile of GUmbie (lower plot, CC value = 0.64). In both plots the red profile represents the measured AM from the labelled molecule and the blue profile represents the theoretical AM.