
Figure 5.
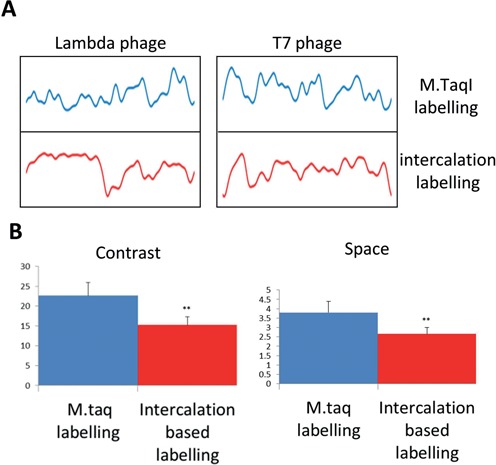
(A) Comparisons between the theoretical AM profiles generated by M.TaqI labelling (upper profiles) and intercalation based GC labelling (lower profiles) on λ (left panel) and T7 (right panel) genomes. (B) Space and Contrast scores were calculated for 20 different phages (see supporting information for full list). The average contrast score is presented in the left graph and the average space score is presented in the right one. In both, M.taqI labelling (blue bar) shows significantly more information than intercalation based labelling (red bar) (P-value <0.005 paired t-test).