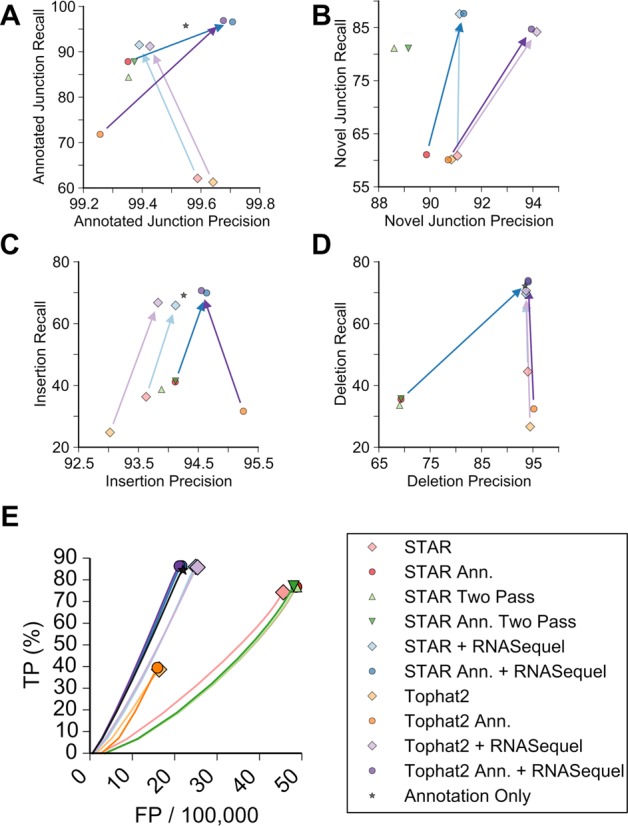
Figure 3.

Alignment characteristics for the second simulated dataset. The recall and precision as a percentage of the number of correctly aligned reads for annotated junctions (A), novel junctions (B), insertions (C) and deletions (D). The alignment algorithms used are indicated according to the legend and the arrows indicate the improvement by RNASequel and are colored according to the legend. (E) Receiver-operator curve demonstrating the relationship of correctly called sequence variants (Y axis) to the number of falsely called variants (X axis) for each read pair across each of the alignment methods. Note that the X-axis scale is false positive variant calls per 100 000 reads.
