Figure 5.

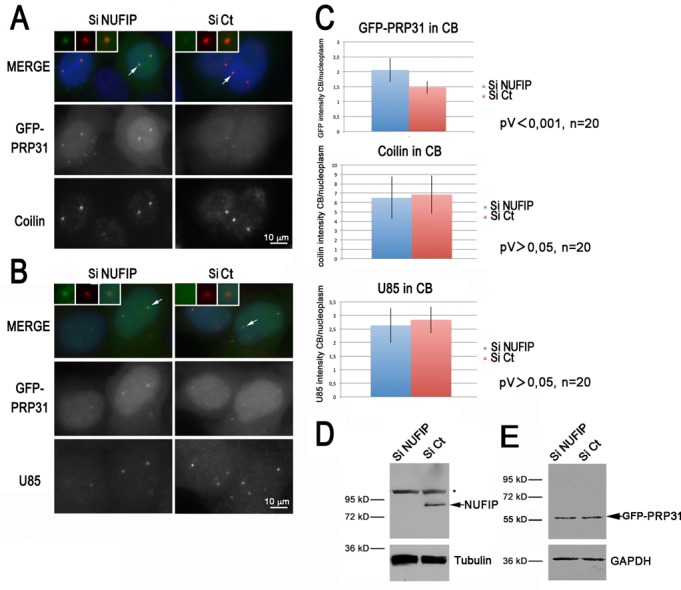
PRP31 accumulates in Cajal bodies following NUFIP depletion. (A) Microscopy images of HeLa cells treated with control (Ct) or NUFIP siRNAs. GFP-PRP31 is visible in green, anti-coilin antibody in red, and DAPI in blue. Scale bar is 10 μm. Insets show zoom of selected CBs. (B) Microscopy images of HeLa cells treated with control or NUFIP siRNAs. GFP-PRP31 is visible in green, FISH labeling of U85 in red, and DAPI in blue. Scale bar is 10 μm. (C) Graph showing the quantification of CB localization of GFP-PRP31, coilin, and U85. Histograms represent an average of signal intensities in CB divided by that of nucleoplasm. (D) Western blot of HeLa extracts treated with control and NUFIP siRNAs, and blotted with anti-NUFIP and anti-tubulin antibodies. Star: non-specific band of the NUFIP antibody. (E) Same as in (D) but anti-GFP and anti-GAPDH antibodies were used for western blot.
