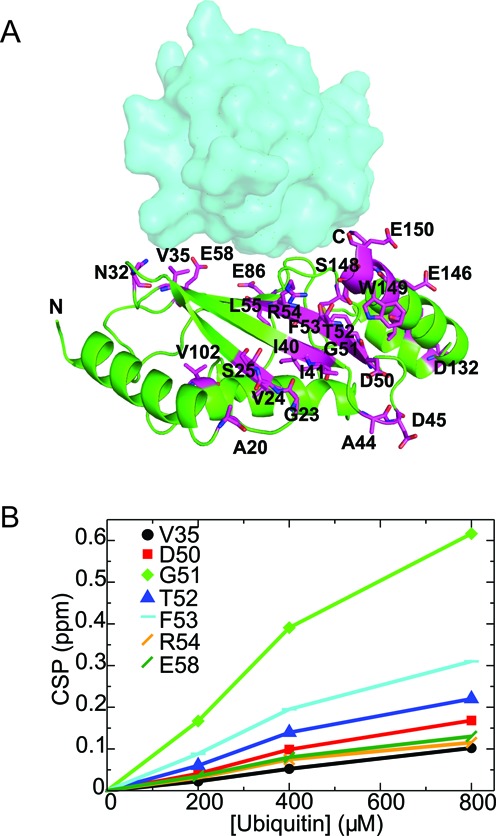
Figure 3.

NMR detection of interactions between Rad6 and ubiquitin. (A) Mapping of perturbed residues of Rad6 upon binding to free ubiquitin in NMR. The perturbed residues with CSP 0.05 ppm and above are shown in magenta color. Ub (cyan) is shown as surface representation on the non-canonical backside of Rad6. (B) Ubiquitin binds to Rad6 with a Kd above 1 mM. The titrations curves for some of the 15N-Rad6 residues that show significant chemical shift perturbations upon free ubiquitin interactions are shown here. The dissociation constant (Kd) was estimated to be ∼1–2 mM assuming a 1:1 stoichiometry and is higher for multiple-site binding models.
