Figure 4.

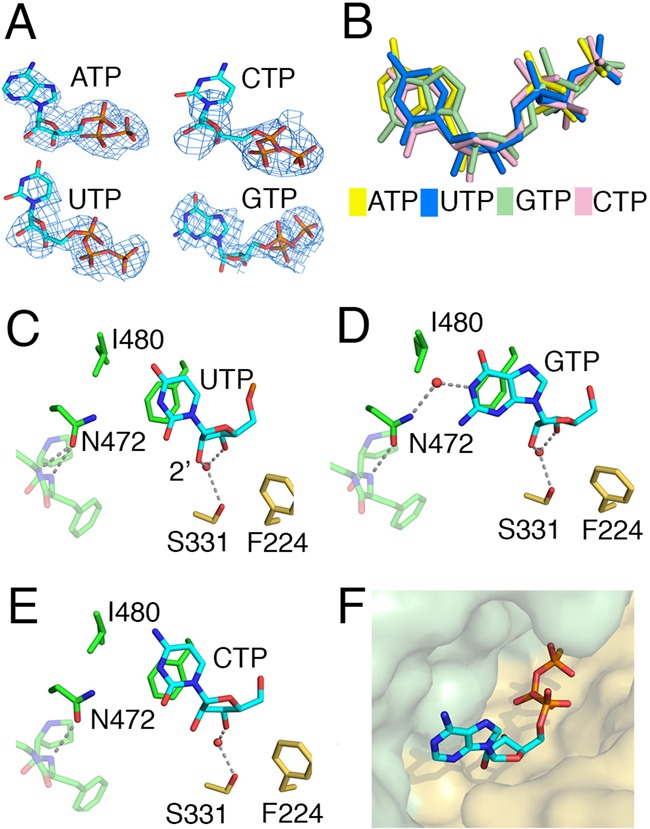
(A) Nucleotides in the mtPAP structures from Mol-B are shown with the simulated annealing Fo-Fc omit map (blue mesh), contoured at 3.0 σ for ATPγS, 2.0 σ for UTP and CTP, and 2.5 σ for GTP. (B) The relative positions of all four bound triphosphate ribonucleotides derived from superpositioning the mtPAP nucleotide-bound structures. (C–E) Key ribose/base interactions between mtPAP and UTP, GTP, and CTP, as found in Mol-B in the bound structures of mtPAP. The same interactions were observed in Mol-A, except in the case of the GTP where only the triphosphate moiety was modeled. (F) Surface representation of mtPAP nucleotide binding pocket with ATPγS shown as a stick model.
