
Figure 3.
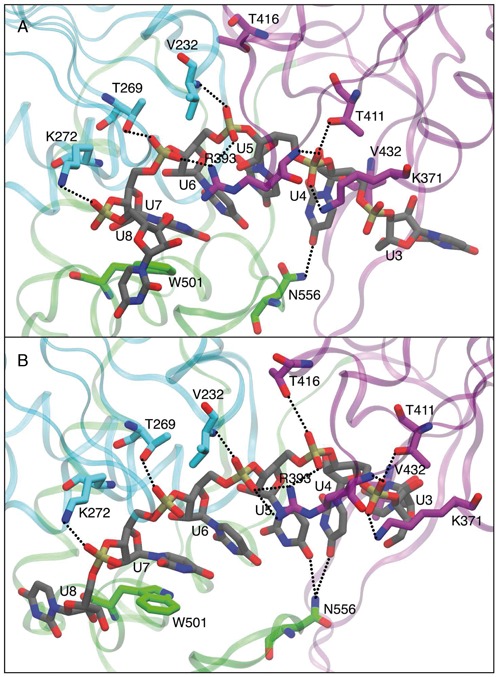
Representation of the RNA binding cleft. Snapshots depicted correspond to the RMSD centroids of trajectories as obtained by the clustering algorithm discussed in ref. (62), using a cutoff radius of 1.25 Å. RNA chain and aminoacids interacting with RNA are highlighted in sticks representation. Residues from D1, D2 and D3 are depicted in cyan, purple and green, respectively, RNA chain is shown in gray color. Snapshots are shown for closed-ATP (A) and open-ATP (B) simulations. Equivalent graphs for the ADP and apo simulations are shown in Supplementary Figure SD5.