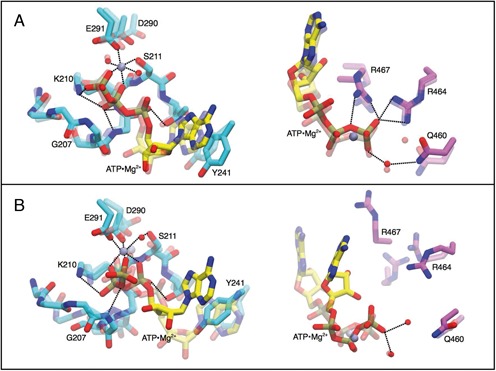
Figure 4.

Snapshots of the ATP/ADP binding site. Aminoacids from D1(cyan) and D2 (purple) and ligand (yellow) are shown as sticks, the magnesium ion is shown as a lilac sphere. Closed-ATP (A) and open-ATP (B) systems are shown. Transparent representation indicates the initial structure, solid color indicates the structure after 1 μs of molecular dynamics. Coordination with Mg2+ cation and hydrogen bond interactions are shown with the black dashed line. Equivalent representations for ADP are shown in Supplementary Figure SD7.
