
Figure 1.
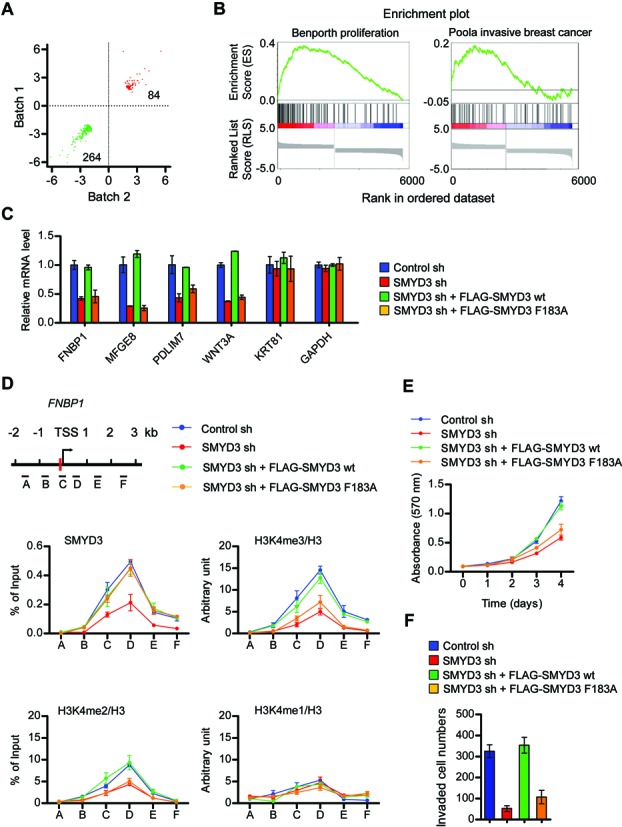
SMYD3 knockdown suppresses cell proliferation/invasion-related genes. (A) Control or SMYD3-depleted HCT116 cells were subjected to microarray analysis. Dots in the two-dimensional scatter-plot represent expression values for the genes with a folder change >2 in either of two independent analyses (Batch #1 and Batch #2). These analyses identified 264 genes that were down-regulated (indicated by green dots) and 84 genes that were up-regulated (indicated by red dots) in the SMYD3-depleted cells, compared to the control cells. (B) Summary of GSEA of microarray data. The Y-axis plots the enrichment score and X-axis is the rank of genes differentially expressed in SMYD3-depleted cells. Bar codes below enrichment plots show the rank position of individual genes differentially expressed in SMYD3-depleted cells. (C) SMYD3 wt and SMYD3 F183A were expressed in SMYD3-depleted HCT116 cells, and relative mRNA levels of the four down-regulated (FNBP1, MFGE8, PDLIM7 and WNT3A) and two unaffected (KRT81 and GAPDH) genes in SMYD3-depleted HCT116 cells were quantified by qRT-PCR. (D) ChIP-qPCR assays were performed in control or SMYD3-depleted HCT116 cells complemented with SMYD3 wt or SMYD3 F183A by using SMYD3, H3K4me1, H3K4me2, H3K4me3 and H3 antibodies. Precipitation efficiencies relative to non-enriched input samples were determined for the six locations across the FNBP1 locus by qPCR with primers depicted on the left and listed in Supplementary Table S4. Percent input is determined as the amount of immunoprecipitated DNA relative to input DNA. The enrichment of H3K4me1/me2/me3 was calculated as the ratio of anti-H3K4me1/me2/me3 ChIP to anti-H3 which is an indication of local nucleosome density. Error bars represent the SD obtained from three independent experiments. The vertical red bar represents the putative SMYD3 binding site. (E) SMYD3-depleted HCT116 cells were infected with SMYD3 wt or SMYD3 F183A as in Supplementary Figure S3A, and changes in cell proliferation rates were measured by the MTT colorimetric assay every day for 4 days post-infection. (F) SMYD3-depleted HCT116 cells were complemented with SMYD3 wt or SMYD3 F183A, and cell invasion activity was determined by the Matrigel invasion assay.