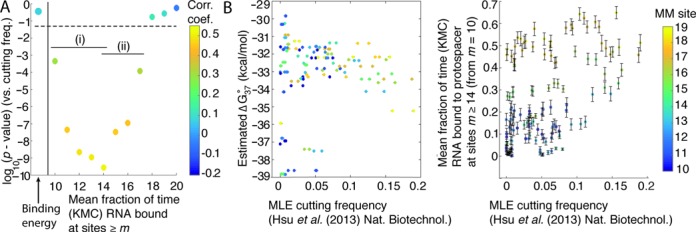
Figure 6.

Experimental (Hsu et al. (2013) (18)) cutting frequencies at target sites containing a single rG·dG, rC·dC, rA·dA and rU·dT mismatch in the PAM-distal region (≥10th protospacer site) are correlated with stabilities of the R-loop determined from KMC experiments. (A) log10(P-value) of the correlations between Cas9 cutting frequency and stability of R-loop at sites m (fraction of time the guide RNA remains bound to the protospacer at site m, see text) during strand invasion initiated at site m = 10. (i) Stability at sites m = 10 to m = 14 is highly anti-correlated with the probability that the guide RNA will fall off the protospacer prior to traversing the mismatch (Supplementary Figure S9B), while (ii) sites m = 14 to m = 17 are associated from AFM images with the conformational change which induces cleavage activity. Colour corresponds to the correlation coefficient. (B) Experimental cutting frequency does not correlate significantly with estimated guide RNA–protospacer equilibrium binding free energies (ΔG°37) (left), while it does with stability of site m = 14 during strand invasion (right). Error bars are standard errors of the mean times site m = 14 is bound by the guide RNAs. For these kinetic Monte Carlo experiments, max(t) = 100 (arbitrary units). Colour bar is used to show the location of the mismatched (MM) site.
