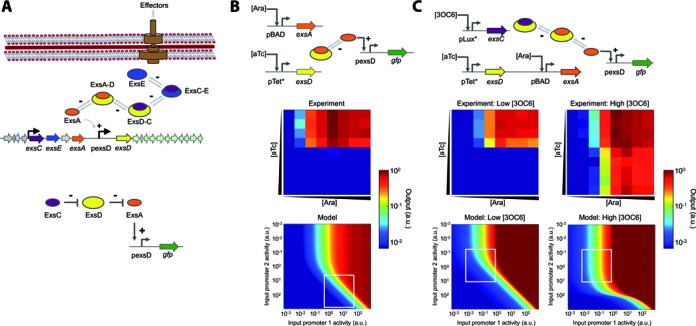
Figure 1.

Characterization of the sequestration-based genetic circuits. (A) Schematic diagram of the Pseudomonas aeruginosa T3SS regulatory cascade. Four regulatory proteins control the P. aeruginosa T3SS through partner swapping. A transcription factor ExsA (orange) activates the target promoter and is sequestered by an anti-activator ExsD (yellow) into an inactive complex (ExsA-D). A chaperone ExsC (purple) frees ExsA by sequestering ExsD and forming ExsD-C. ExsE (blue) inhibits T3SS activation by sequestering ExsC and forming ExsC-E. +, activating interaction; –, repressing interaction. A simplified diagram showing the functions of the three ExsADC regulators used in this work is also shown (bottom). (B) A two-member system allows for tunable output. ExsA expressed from an inducible promoter (pBAD) controls GFP expression via the ExsA-inducible promoter (pexsD). Another inducible promoter (pTet*) controls ExsD expression, which represses GFP expression by sequestering ExsA. Heat maps compare the experimental transfer function to a model plotted over a wide range of promoter activities (Supplementary Data). (C) A three-member system enables fine-tuning of output expression. ExsC allows for output tuning by sequestering ExsD (as indicated by low and high 3OC6 concentrations). Heat maps compare the experimental transfer function to a model plotted over a wide range of promoter activities (Supplementary Data). Note that the heat maps cannot be directly compared due to rescaling of the axes from inducer concentration to promoter activity. Supplementary Figure S1 shows a quantitative comparison (with an R2 of 0.92 or higher). Output values and input promoter activities are reported in arbitrary units (a.u.). The experiments were performed at arabinose (Ara) concentrations of 0, 0.0016, 0.008, 0.04, 0.2, 1, 5, and 25 mM (from left to right); anhydrotetracycline (aTc) concentrations of 0, 3.2, 16, 80, 400, 2000, 10 000, 50 000, 250 000 and 500 000 pg/ml (from top to bottom); and 3-oxohexanoyl-homoserine lactone (3OC6) concentrations of 0 and 200 nM for low and high [3OC6], respectively. White boxes represent the experiment ranges obtained using the inducible promoters. Experimental data are the averages of nine replicates performed on three different days.
