
Figure 2.
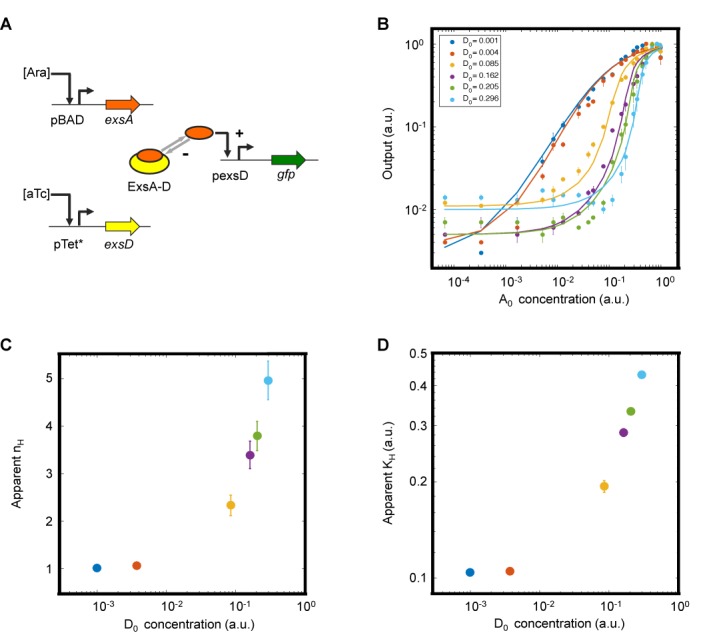
Sequestration-based tuning of ultrasensitivity. (A) Schematic diagram of the genetic circuit constructed to independently control ExsA and ExsD expression. ExsA is sequestered into an inactive complex (ExsA-D), which is the basis of ultrasensitivity. +, activating interaction; –, repressing interaction. (B) Input–output response at different amounts of ExsD (D0). The total ExsD amount (0.001, 0.004, 0.085, 0.16, 0.21 and 0.30 in a.u.) was calculated using a fitted transfer function model (Supplementary Data). Filled circles and solid curves represent the experimental data and fitted transfer functions (with an R2 value of 0.99, Supplementary Table S3), respectively. The experiments were performed at Ara concentrations of 0, 0.0000128, 0.000064, 0.00032, 0.001, 0.0016, 0.0025, 0.005, 0.008, 0.01, 0.016, 0.025, 0.04, 0.05, 0.08, 0.1, 0.15, 0.2, 0.4, 1, 5 and 25 mM and aTc concentrations of 40, 50,000, 250 000, 350 000, 400 000 and 500 000 pg/ml. (C and D) The apparent Hill coefficient (nH) and the apparent half-maximal concentration (KH) are shown as functions of the anti-activator levels (D0). The data and error bars represent the averages and SEM of six replicates performed on three different days, respectively.