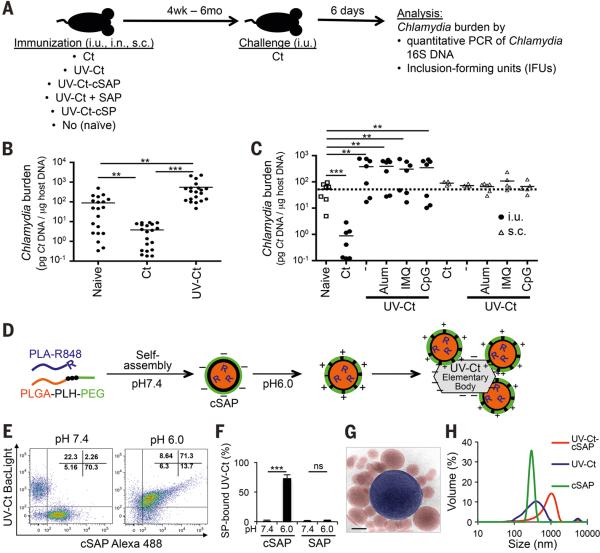
Figure 1. Differential effects of immunization with Ct / UV-Ct and conjugation of UV-Ct with synthetic nanoparticles.
(A) Schematic diagram of the immunization and challenge protocol for Figs. 1B-C, 2A-C, 2F, 3A-B, 4E-F, 6A, S4 and S7. Mice were immunized with Ct, UV-Ct, UV-Ct-cSAP or UV-Ct mixed with control nanoparticles (Ct, live Chlamydia trachomatis; UV-Ct, inactivated Chlamydia trachomatis; UV-Ct-cSAP, inactivated Chlamydia trachomatis complexed with charge-switching synthetic adjuvant particles; UV-Ct + SAP, inactivated Chlamydia trachomatis mixed with synthetic adjuvant particles (not attached to UV-Ct); UV-Ct-cSP inactivated Chlamydia trachomatis complexed with charge-switching synthetic particles (without adjuvant)) via intrauterine (i.u.), intranasal (i.n.) or subcutaneous (s.c.) routes. Challenge with live Ct was always i.u. (B) Uterine Ct burden was measured by qPCR 6 days post i.u. challenge with live Ct in naïve mice and in animals that had been immunized 4 weeks earlier by i.u. injection of infectious Ct or UV-Ct. Data are pooled from 4 independent experiments (n= 20 mice per group; **P<0.01; ***P<0.001; one-way ANOVA followed by Bonferroni's post-test). (C) Ct burden following i.u. or s.c. immunization with UV-Ct mixed with adjuvants: alum, aluminum hydroxide; IMQ, imiquimod; CpG, CpG oligodeoxynucleotide type C (n= 5-7 mice per group; **P<0.002; ***P<0.001; one-way ANOVA followed by Bonferroni's post-test). (D) Schematic representation of surface charge-switching synthetic adjuvant particle (cSAP) production and conjugation to UV-Ct. (E-F) UV-Ct stained with BacLight was incubated with Alexa Fluor488 labeled cSAP or SAP at pH 7.4 or 6.0. (E) Representative FACS plots and (F) quantification of nanoparticle conjugates with UV-Ct from 2 independent experiments. ***P<0.001; ns, not significant; two-tailed t-tests. (G) A representative cryo-transmission electron micrograph of a UV-Ct–cSAP cluster showing cSAP in red and UV-Ct in blue. Scale bar: 100 nm. (H) Dynamic light scattering profiles of UV-Ct–cSAP, cSAP and UV-Ct alone. The population distribution is representative of the volume scattering intensity. Data are representative of 10 independent experiments. Error bars represent mean ± SEM.

