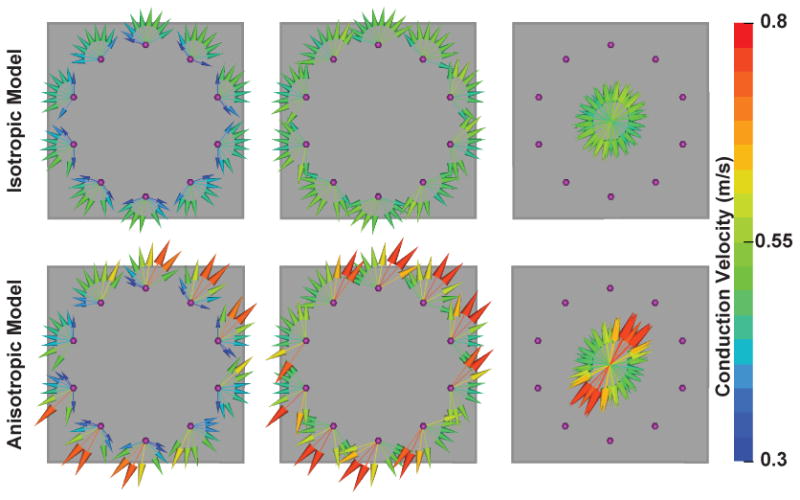
Figure 2.

Characterization of local conduction properties with loop catheter. Left Column – Vectors at recording electrodes (purple spheres) point away from pacing site. Length and color correspond to conduction velocity (CV). Center Colum – CV vectors normalized to fixed distance from pacing site. Right Column – Compact representation of regional conduction.
