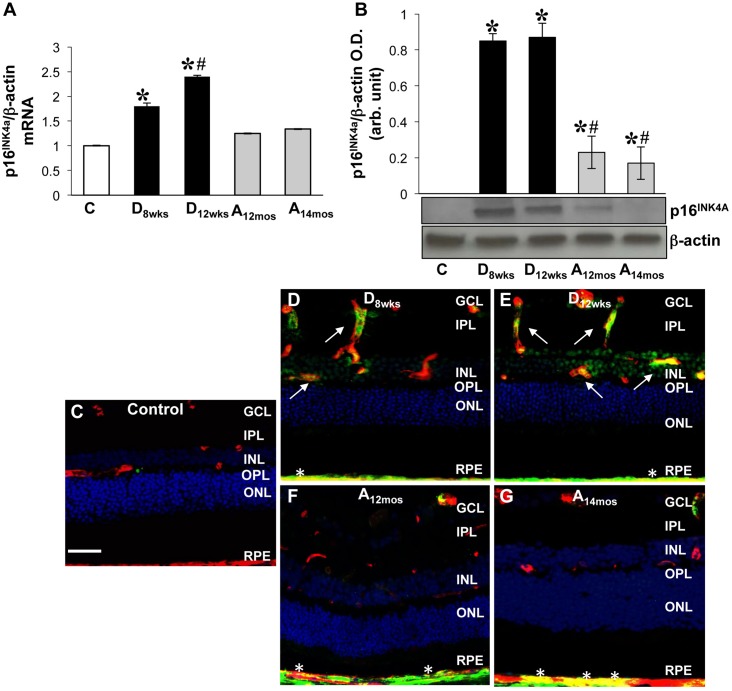
Fig 5. Measurements of p16INK4a levels in rat retinas.
A) Expression of p16INK4a at mRNA level was measured using qPCR in retinal extracts from control, STZ, and aging rat retinas (as indicated above). Levels of p16INK4A specific mRNA are expressed as a ratio to β-actin and normalized to baseline controls. x ± S.D, *p<0.009 vs control 4.5 month rat retina; #p<0.01 vs D8wks, n = 6. B) Western blotting analysis measuring p16INK4a protein levels; bar histogram depicts p16INK4a protein levels normalized to β-actin in retinal extracts. x ± S.D,*p<0.01 vs C; #p<0.04 vs D8wks diabetic, n = 6. Control retinas = white bar; aging retinas = gray bar; diabetic retinas = black bar. C-G) Frozen retinal sections were probed with anti-p16INK4a (green) antibodies and isolectin B4 (red) to detect anti-p16INK4a -specific immunoreactivity in retinal vessels of control (C), diabetic (D-E), and aging (F-G) rats. Areas of merging labeling (yellow) are indicated by the white arrows. White asterisks show p16INK4a positivity at the RPE/choroid level. Hoescht staining was used to detect cellular nuclei (blue). Scale bar equal to 50 μm.

