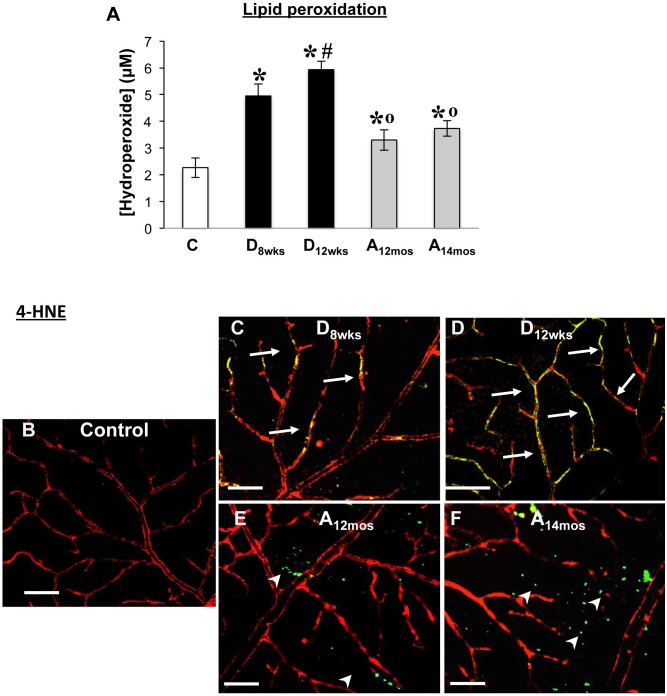
Fig 7. Measurements of lipid oxidative modifications.
Bar histogram is representative of measurements of chloroform/methanol extracted hydroperoxides (A) in retinal rat tissues in the different treatment groups. x ± S.D, *p<0.0001 vs C, #p<0.0001 vs D8wks, °p<0.0001 vs D8wks, n = 6. Immunohistochemical analysis using anti-4-HNE specific antibodies in retinal flat mounts is shown in panels B and C. Areas of merging labeling (yellow) are indicated by the white arrows. White arrowheads indicate extravascular areas immunoreactive to 4-HNE. Scale bar equal to 20 μ m.

