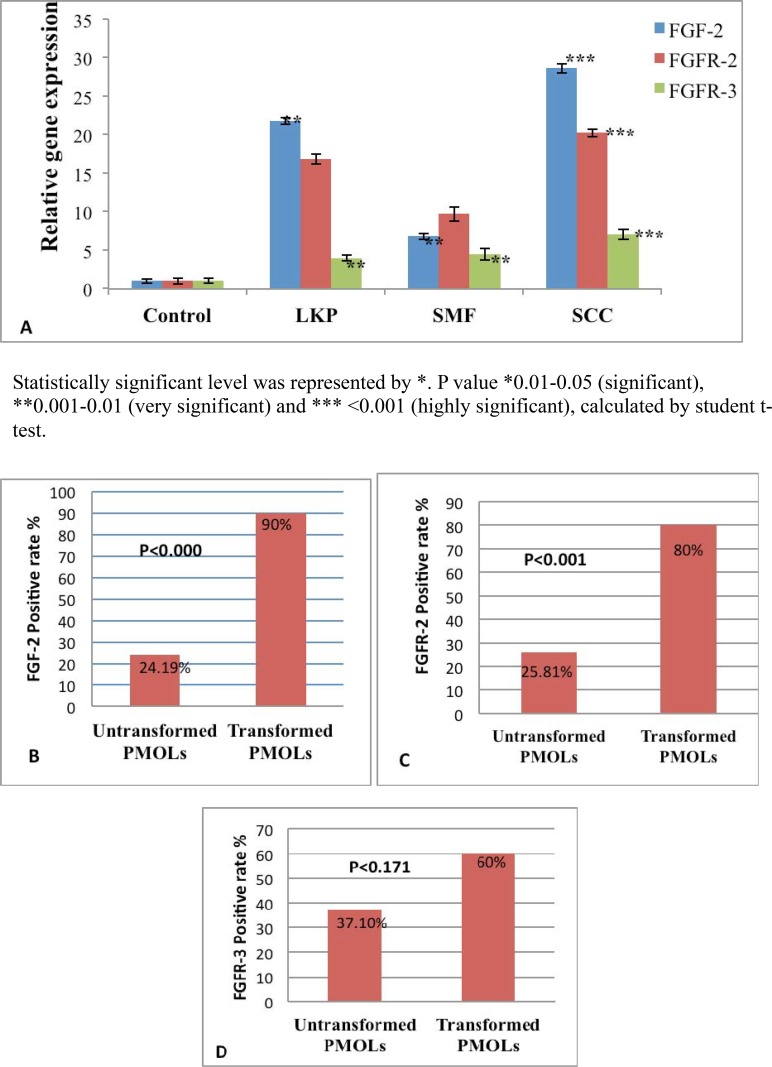
Fig 4. Real time PCR results of FGF-2, FGFR-2 and FGFR-3 and frequency of FGF-2, FGFR-2 and FGFR-3 malignant transformation rate (A-D).
Bar diagram showing fold change expression of FGF-2, FGFR-2 and FGFR-3 by Real Time. A, PCR in OSMF, LKP, OSCC and healthy controls. B, Frequency of FGF-2 malignant transformation rate in PMOLs. C, Frequency of FGFR-2 malignant transformation rate in PMOLs. D, Frequency of FGFR-3 malignant transformation rate in PMOLs.

