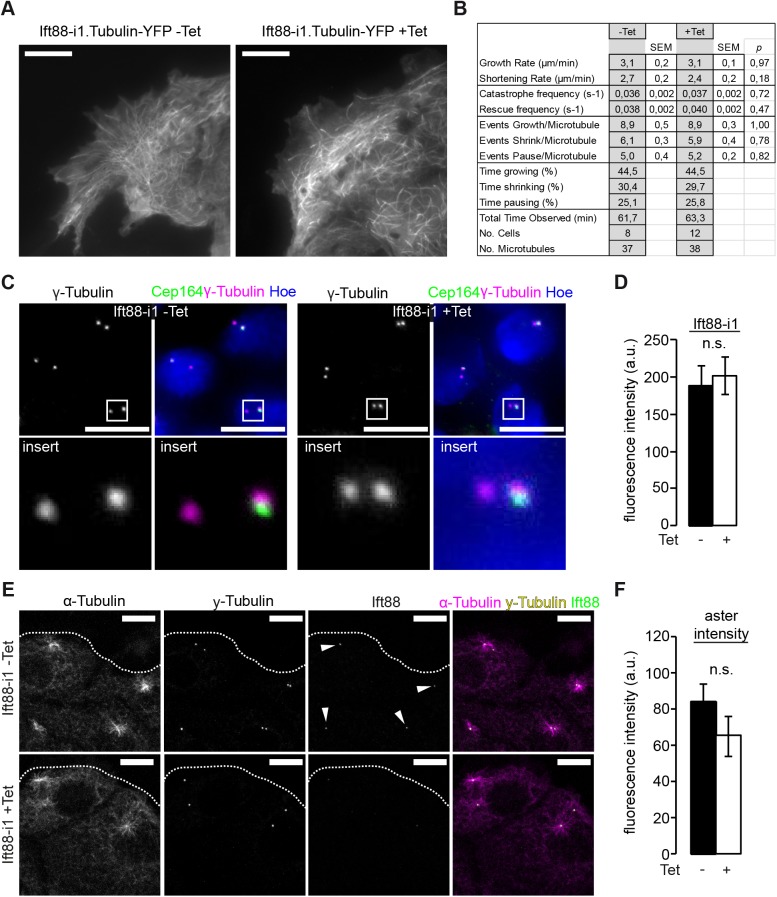
Fig 6. Ift88 does not influence MTOC activity.
(A) Migrating Ift88-i1 cells with stably transduced α-Tubulin-YFP (Ift88-i1.Tubulin-YFP) were subjected to TIRF microscopy and MT were assessed. The number of MT probing into the leading edge is reduced upon Ift88-knockdown compared to non-induced controls, but (B) no changes in MT dynamic instability were observed. (C) The amount of γ-Tubulin at the centrioles appears similar in Ift88-knockdown cells (+Tet) compared to non-induced controls (-Tet). Lower panel shows magnifications of the white squares. (D) Quantification of γ-Tubulin fluorescence intensity reveals no significant difference between -Tet (188.3 ±27.3 a.u.) and +Tet (201.5 ±25.1 a.u.) conditions. p = 0.72, n = 6, 19 fields of view each, 556/461 cells. (E, F) Migrating Ift88-i1 cells as in Fig 4A were subjected to MT depolymerization with nocodazole and subsequently MT regrowth was analyzed. Dotted line illustrates the leading edge. No significant difference was observed in aster intensity (-Tet: 84.0 ±9.9 a.u. vs. +Tet: 65.2 ±11.0 a.u., p = 0.27, n = 3, total of 33/34 centrosomes). Ift88-knockdown was confirmed by staining for Ift88 comparing fluorescence intensity at the mother centriole in ±Tet conditions (-Tet: 84.1 ±11.8 a.u vs. +Tet: 34.8 ±11.0 a.u., p<0.05, n = 3). Scale bars: 10μm.

