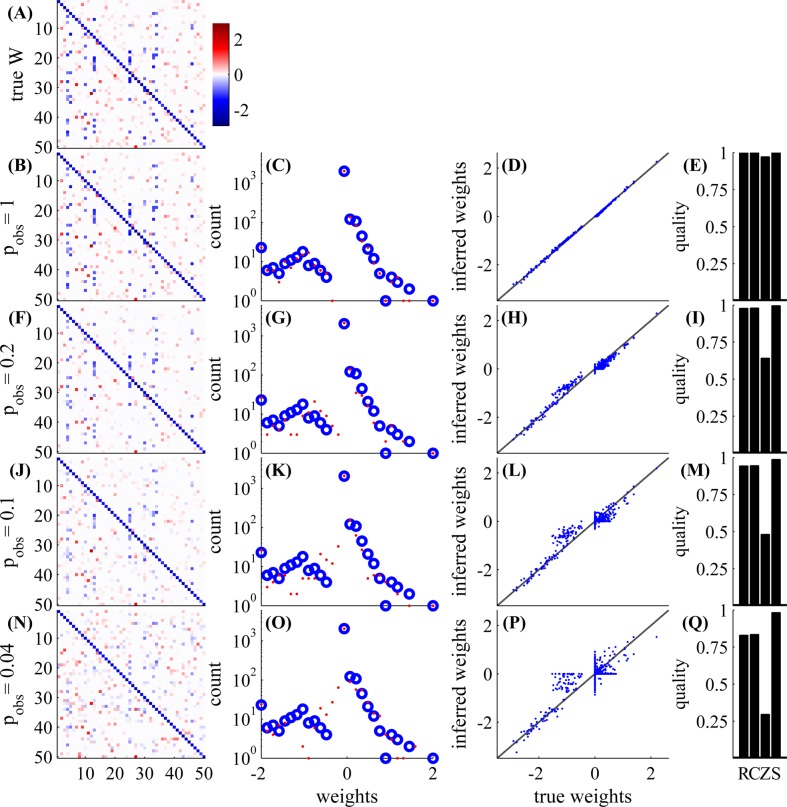
Fig 3. Network connectivity can be well estimated even with low observation ratios.
With N = 50 neurons, and an experiment length of 5.5 hours, we examine various observation probabilities: p obs = 1,0.2,0.1,0.04. Left (A,B,F,J,N): weight matrix (either true or estimated). Middle left (C,G,K,O): non-zero weights histogram (blue—true, red—estimated). Middle right (D,H,L,P): inferred weight vs. true weight. Right (E,I,M,Q): quality of estimation—S = sign detection, Z = zero detection, C = correlation, (for exact definitions see Eqs 40–43 in S1 Text); higher values correspond to better estimates. In the first row, we have the true weight matrix W. In the other rows we have the inferred W—the MAP estimate of the weight matrix with the L1 prior (section C in S1 Text), with λ chosen so that the sparsity of the inferred W matches that of W. Estimation is possible even with very low observation ratios; in the lowest row we observe only 2 neurons out of 50 in each time bin. The weights on the diagonal are estimated better because we observe them more often in double serial scanning scheme (Fig 1I, 1J).

