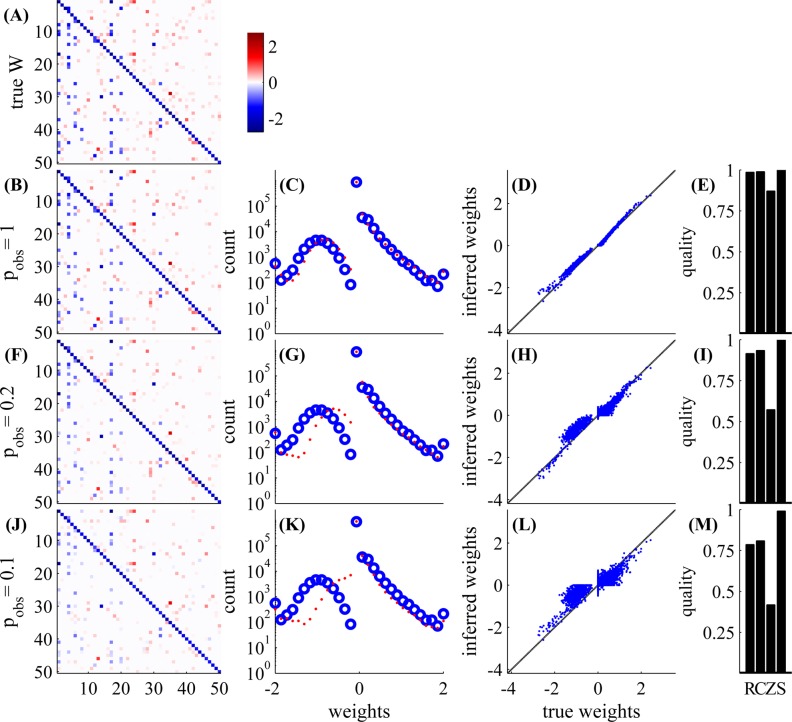
Fig 5. Network connectivity can be well estimated even with a large network.
The panels (A-M) are arranged in columns as in Fig 3, except now we have N = 1000 observed neurons and additional 200 unobserved (this is the same simulation as in Fig S1), and p obs = 1, 0.2 and 0.1. In the left (A,B,F,J) and middle right columns (D,H,L) we show a random subset of 50 neurons out of 1000, to improve visibility. The other columns show statistics for all observed neurons. On a standard laptop, the network simulation takes about half an hour, and the connectivity estimate can be produced in minutes. Therefore, our algorithm is scalable, and much faster than standard GLM based approaches, as we explain in section 6.2.

