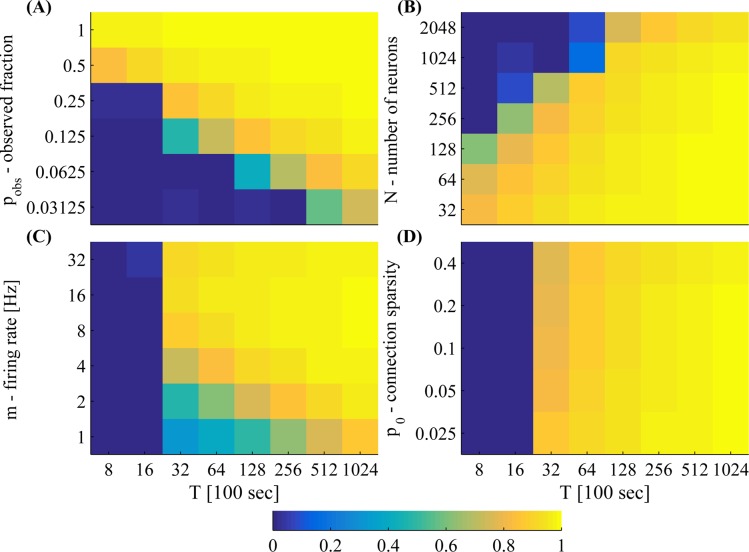
Fig 7. Parameter scans show that C, the correlation between true and estimated connectivity, monotonically increases with T in various parameter regimes.
We scan over (A) observation probability p obs, (B) network size N, (C) mean firing rate m (similar to the firing rate of the excitatory neurons—inhibitory neurons fire approximately twice as fast), and (D) connection sparsity parameter p 0 (which is proportional to actual connection sparsity p conn—see Eq 37 in S1 Text) and experiment duration T. Other parameters (when these are not scanned): p obs = 0.2, N = 500.

