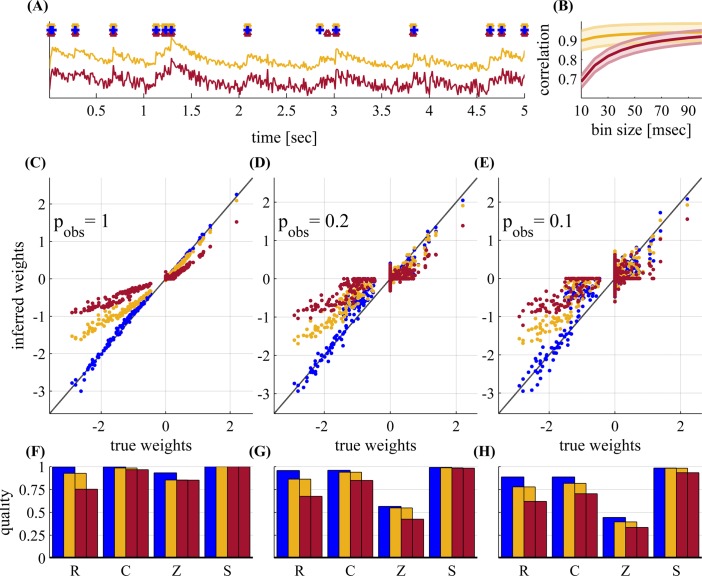
Fig 10. Inferring connectivity from fluorescence measurements from a network with N = 50 observed neurons—for different noise regimes: none (blue), low (yellow, snr = 0.2) and high (brown, snr = 0.4).
(A) A short sample showing the fluorescence traces, for both noise regimes. On top we show the actual spikes (blue cross), and inferred spikes for low / high noise (yellow/brown triangles). (B) Correlation (population mean ± std) between actual and inferred spikes,for both low and high noise regimes. We bin the spikes (both actual and inferred) at various time bin sizes (x axis) and calculate the correlation using the definition of C (Eq 41, only for spikes instead of weights). Spikes are reasonably well estimated, given the noisy fluorescence traces. (C-E) Estimated weights vs. true weights for p obs = 1, 0.2 and 0.1. (F-H) Quality of inference for the C-E, respectively. Blue—spikes are directly measured, Yellow / brown—spikes are inferred from the respective fluorescence traces. Inhibitory weights exhibit more “shrinkage” due to their higher firing rate, which makes it harder to infer spikes from fluorescence. The mean firing rate is 3Hz, and T = 5.5 hours.

