Fig. 8.
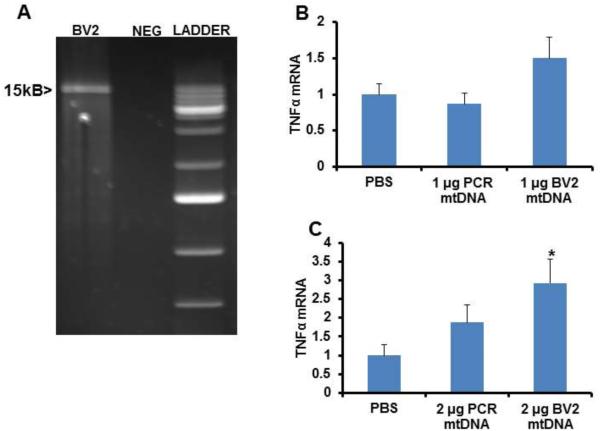
Effect of mtDNA on microglial cell TNFα expression. (A) Long PCR of mtDNA. The band shown is approximately 15kb in size. Neg=negative control PCR. (B) BV2 cells were treated overnight with either 1 μg of native enriched mtDNA from BV2 cells or 1 μg of PCR-amplified mtDNA. (C) BV2 cells were treated overnight with either 2 μg of native enriched mtDNA from BV2 cells or 2 μg of PCR-amplified mtDNA. In (B) and (C), twelve independent samples were prepared and analysed for each condition. Values shown are relative group means ± SEM, with the control group set to 1. * indicates p<0.05.

