
Figure 3.
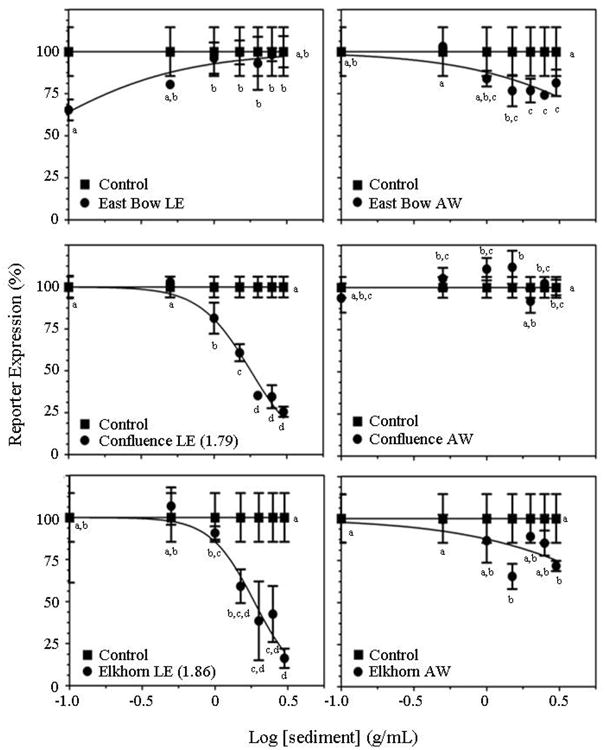
Dose-response curves for aqueous-rinsed sediment fractions (AWs) and lipid-soluble sediment extracts (LEs) from each of the sites on day 0 using the 4-hr yeast bioassay. Control samples containing only 17β-estradiol (E2) are indicated by the line connected by the closed squares. Samples containing sediment extract in the presence of E2 are indicated by closed circles. Each data point represents the mean of 3 independent replicates with error bars indicating standard deviation. All data were normalized to 100% with the highest value being established as either the first or last value, whichever is higher. Letters indicate significant differences between groups.