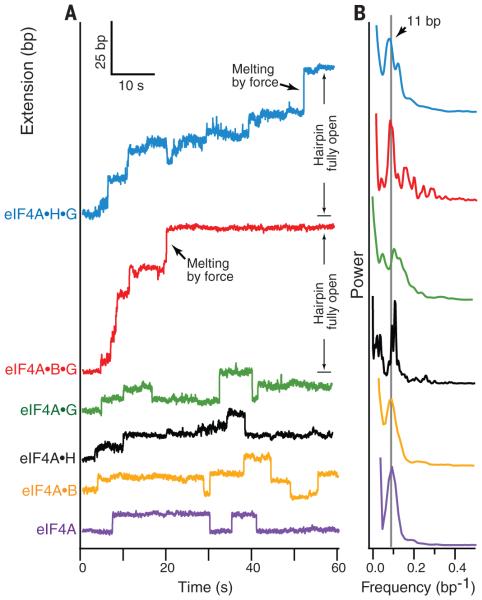
Fig. 2. Factordependent processivity of eIF4A.
(A) Representative singlemolecule records of helicase activity of eIF4A (purple), eIF4A•B (yellow), eIF4A•H (black), eIF4A•G (green), eIF4A•B•G (red), and eIF4A•H•G (blue) over a 60-s interval under constant load; traces are offset vertically for clarity. Note instances of forward motion corresponding to hairpin unwinding (extension increase) and rearward motion corresponding to hairpin reannealing (extension decrease). The final extension increase leading to full opening of the hairpin was facilitated by force, once the ever-shortening duplex region remaining became unstable under the constant load (black arrows; red and blue traces). (B) Normalized power spectra of the pairwise distances derived from multiple records of helicase and cofactor activities, color-coded as in (A), showing prominent peaks at a spatial frequency (0.09 bp−1, gray line) corresponding to an ~11-bp step. Each power spectrum represents an average of at least 50 different single-molecule records.

