
Fig 1.
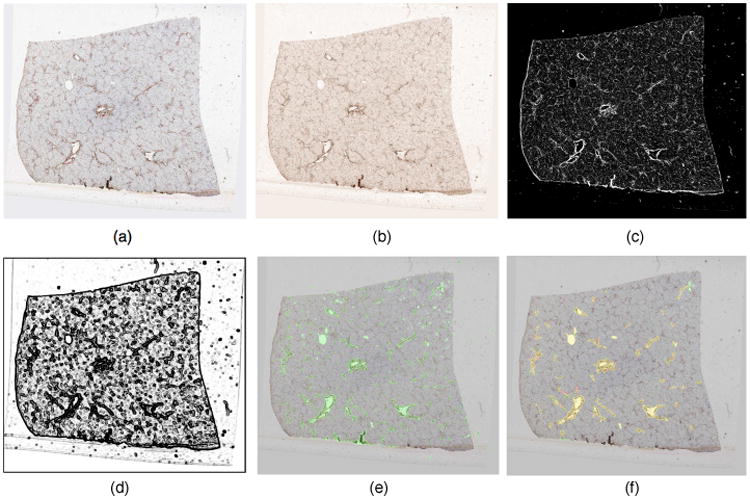
Representative segmentation result of primary vessels. (a) a typical 2D liver histology image with vessels highlighted in brown; (b) DAB stain image channel derived from color deconvolution; (c) vessel wall probability map P(x); (d) smooth indicator function Qσ3(x); (e) segmented primary vessels after post-processing (in green); and (f) markup image with one-to-one vessel pairs by human (red) and machine (green), with yellow mask resulting from red and green mask.