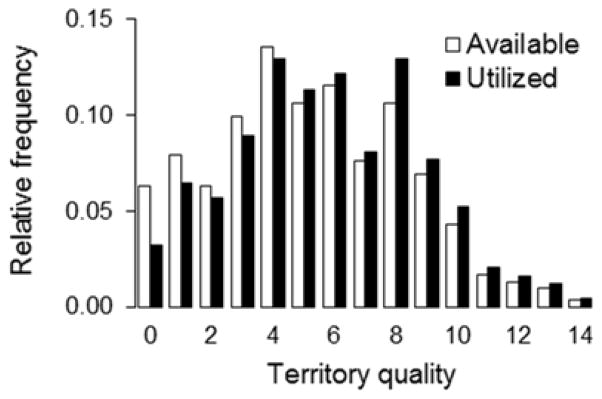
Figure 1.

Variation in territory quality, quantified as the number of broods produced at a given nesting site over the ten years prior to this study. Open bars represent available territories (N = 302 nestboxes), and filled bars represent the sites occupied in the present study (N = 247). The average number of broods produced on a territory over the ten years prior to this study was 5.23 ± 0.18 (mean ± SE); thus, during this study, low-quality territories were under-occupied and high-quality territories were over-occupied relative to the null expectation ( , P < 0.001).
