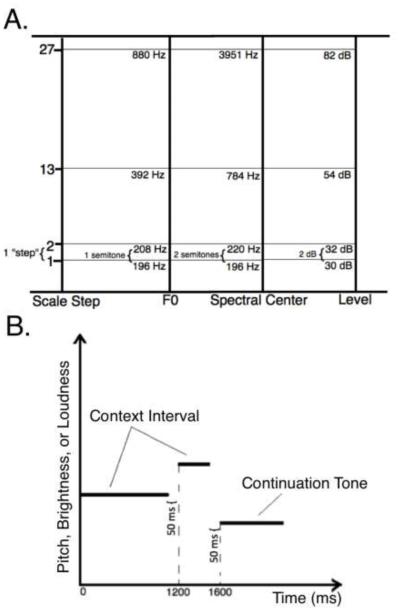
Figure 2.
(A) Visual representation of the scales used for F0 (for pitch melodies), spectral center (for brightness melodies), and level (for loudness melodies). Each scale contains 27 steps; the values of the 1st, 2nd, 13th, and 27th steps are given as examples. (B) Schematic diagram of an example melody, where horizontal lines represent individual tones in the melody.

