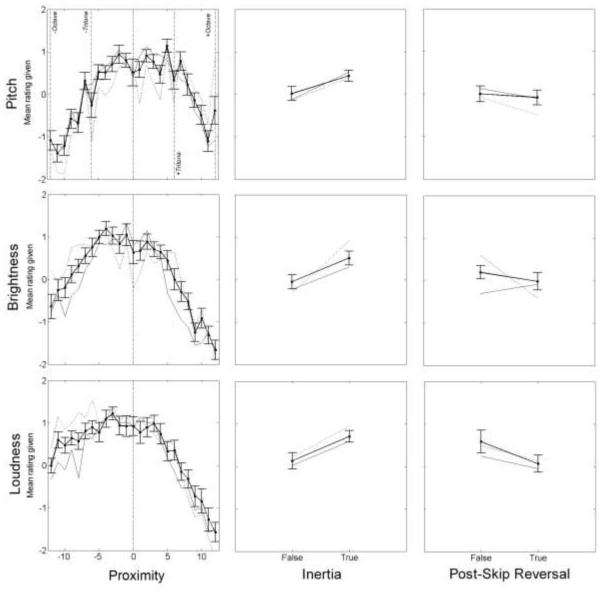
Figure 3.
From Experiment 1, listener ratings of continuation for three-tone sequences in pitch (top), brightness (center), and loudness (bottom). Columns correspond to the three predictors (Proximity, Inertia, and Post-skip Reversal). Vertical dashed lines mark important values of the Proximity predictor. Mean ratings from all subjects are plotted in black with error bars +/− one standard error (between subjects). Dotted lines show mean ratings from the 4 subjects with 12 or more years of musical training. Thin solid lines show mean ratings from the 5 subjects with 1 or fewer years of musical training.

