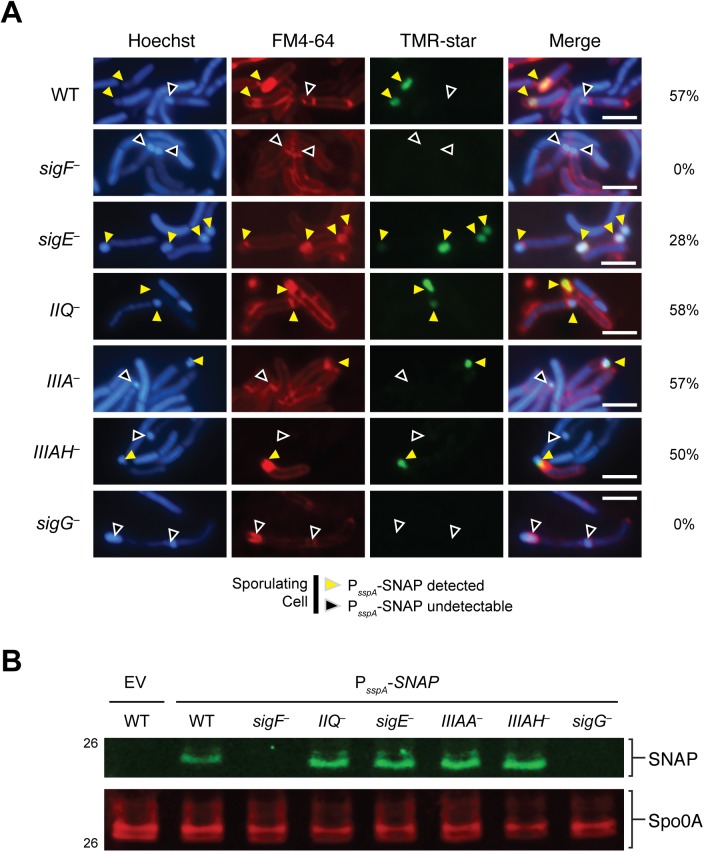
Fig 5. σG activity is localized to the forespore in spoIIQ, spoIIIAA, and spoIIIAH mutants.
(A) Fluorescence microscopy analyses of the indicated strains carrying the σG-dependent PsspA-SNAP transcriptional reporter. Cells were collected after growth on sporulation media for 22 hr and stained with TMR-Star to monitor σG activity (green), the lipophilic dye FM4-64 (red), and Hoechst nucleoid dye (blue). Yellow arrows denote forespores where σG-activity is detectable by TMR-Star staining. Black arrows mark sporulating cells where σG activity was not observed. The percentage of cells for each strain producing visible SNAP for each strain is shown (at least 50 sporulating cells per strain were counted). (B) Western blot analyses of strains carrying the σG-dependent PsspA -SNAP transcriptional reporter using an anti-SNAP antibody. The anti-Spo0A antibody serves as a control for the extent of sporulation [45]. Scale bars represent 3 μm.

