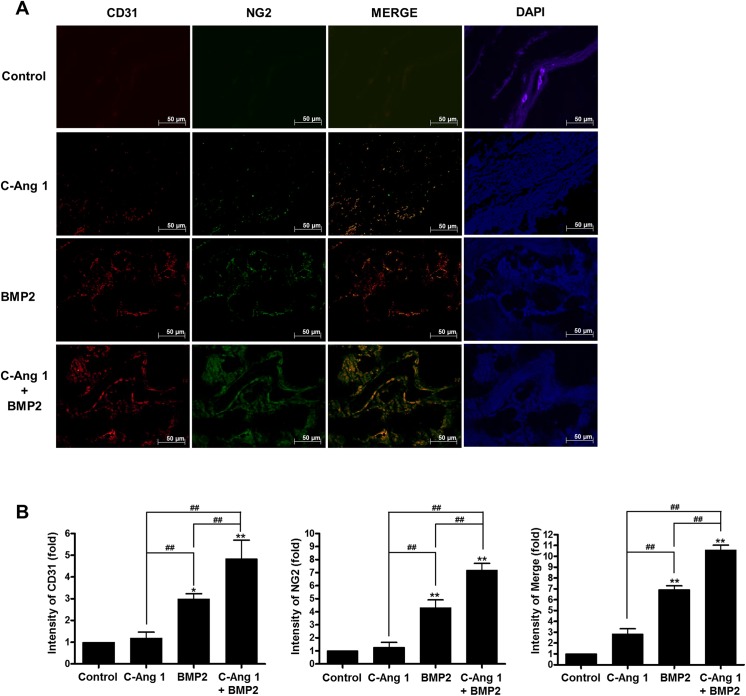
Fig 3. Immunofluorescent analysis for vascular formation and pericyte recruitment in defected regions.
(A) Representative images of immunofluorescence staining with primary anti-CD31 and anti-NG2 antibodies. Immunoreactivities for CD31 (a marker of endothelial cells, red) or NG2 (a specific marker of pericyte, green) were visualized by Alexa Fluor 488-conjugated donkey anti-mouse IgG and Alexa Fluor 555-conjugated goat anti-rabbit IgG. For co-localization of endothelial cells and pericytes, the immunofluorescence images were merged (orange). DAPI (blue) was used as a nuclear counterstain. (B) Fold changes of immunofluorescence intensity. Immunoreactivities against anti-CD31 and anti-NG2 were quantified by using image analysis software (Carl Zeiss LSM software). *, p<0.05, and **, p <0.01 compared to control group, respectively. ##, p <0.01, as compared to the indicated group. n = 4.

