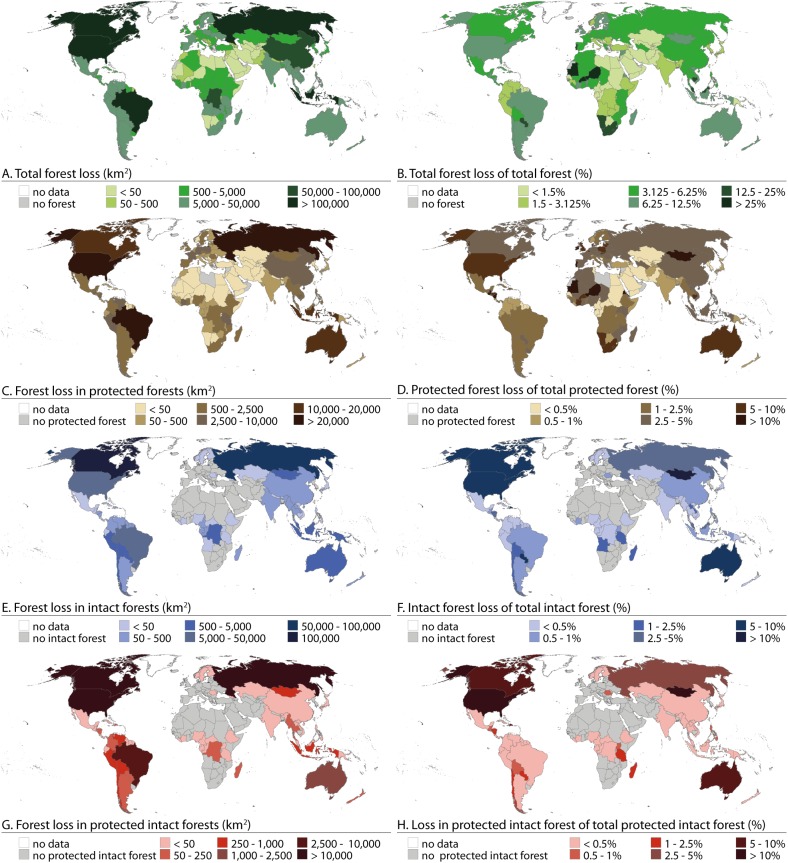
Fig 3. Absolute and relative forest losses by country between 2000 and 2012.
Absolute forest losses (left column) are presented in km2 and relative forest losses (right column) are in %. A and B) Total forest loss; C and D) Loss in protected forests; E and F) Loss in intact forest; G and H) Loss in protected intact forests.

