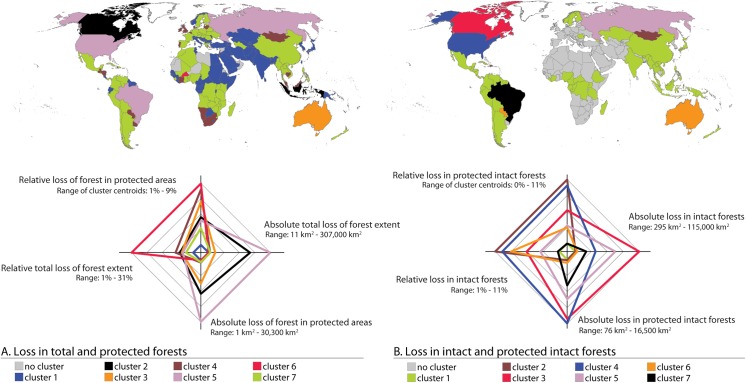
Fig 4. Clustering of countries by their forest loss patterns.
A) country clusters based on absolute and relative losses in total and protected forest; and B) country clusters based on intact and protected intact forest. The cluster characteristics are illustrated by radar charts, of which radii represent the variables used in the clustering. The absolute range in each variable is given next to the variables. The cluster centroids on each variable are plotted on the radii, and these centroids are connected with lines. The countries within each cluster are mapped above the corresponding radar chart and the colours both, in the radar charts and their corresponding maps, indicate the cluster in question.

