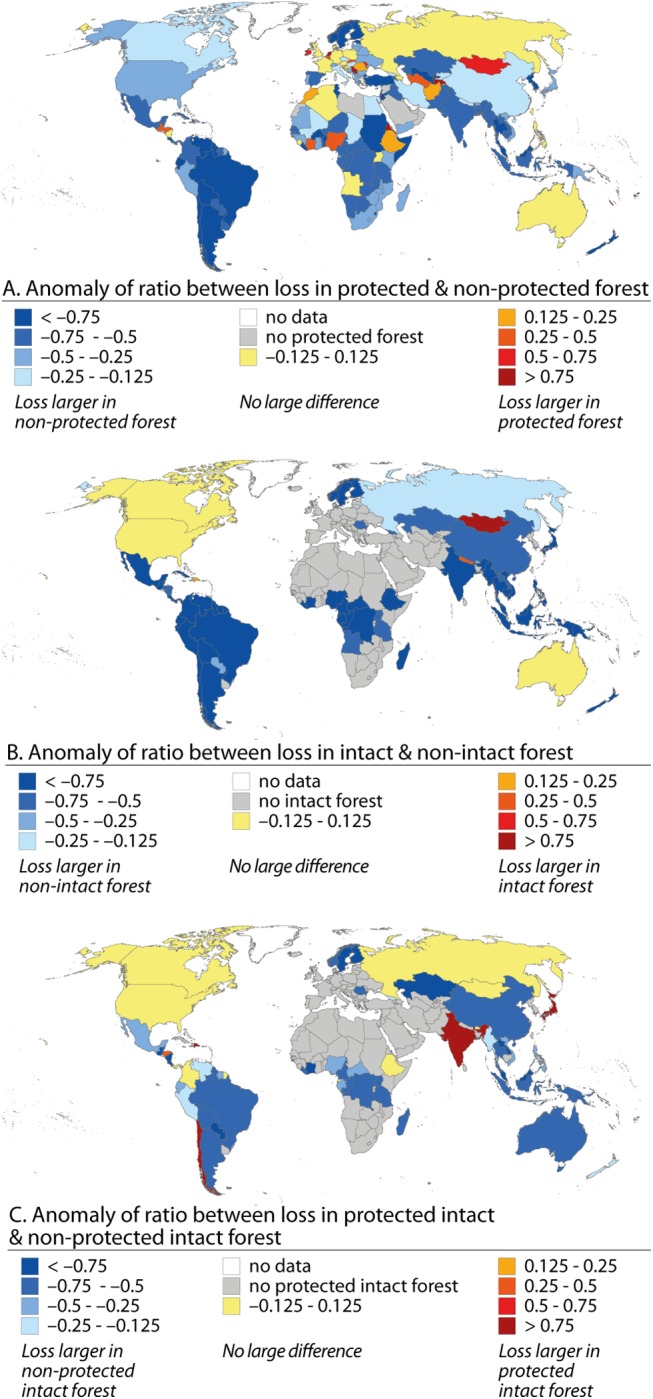
Fig 5. Comparison of forest loss between different forest types: A) Anomaly ratio for loss in protected forest and loss in non-protected forest; B) Anomaly ratio for loss in intact forest and loss in non-intact forest; C) Anomaly ratio for loss in protected intact forest and loss of non-protected intact forest (anomaly ratio <0 (>0) indicates that forest loss is lower (higher) in the protected forest type than in the non-protected forest type).

Note: all the anomalies were calculated with relative losses.
