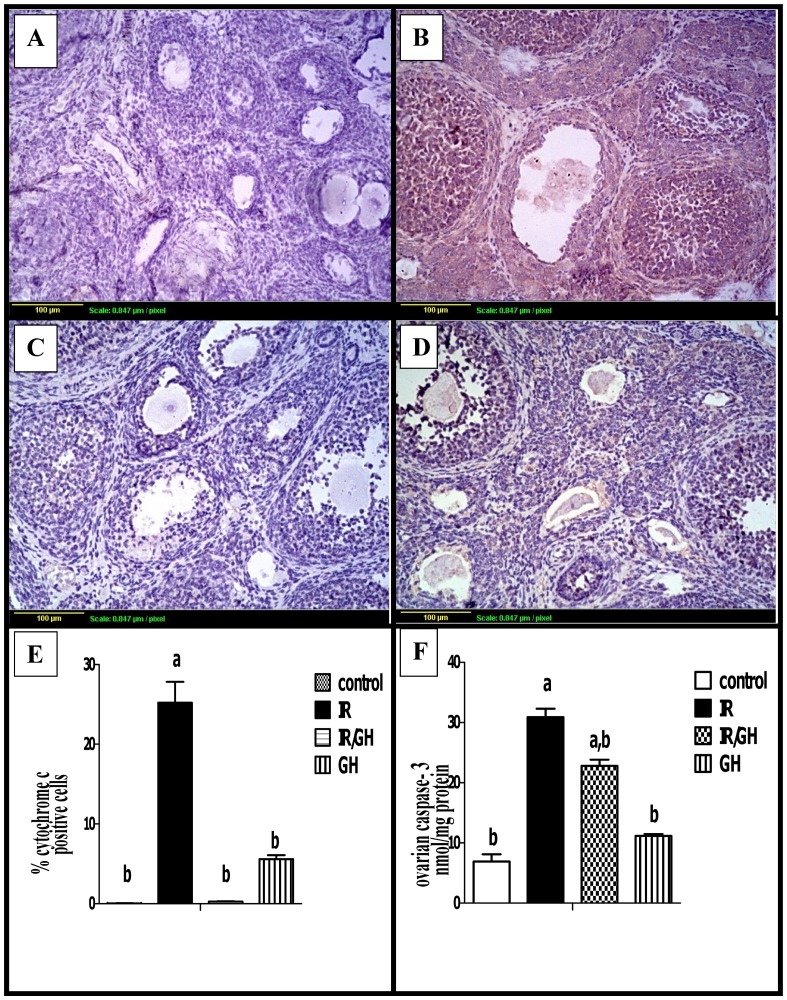
Fig 5. Immunohistochemical localization of cytochrome c.
(A): section of ovary obtained from the control rats shows minimal degree of Cyto c expression (brown color). (B): section of ovary obtained from rats exposed to γ- irradiation (3.2 Gy) shows extensive Cyto c expression (brown color) in granulosa cells of all follicles. (C): section of ovary obtained from rats treated with GH (1mg/kg) and exposed to γ- irradiation (3.2 Gy) shows limited Cyto c expression (brow color). (D): section of ovary obtained from rats treated with GH (1mg/kg) alone for one week shows minimal Cyto c expression of granulosa cells (brown color). Scale bar, 20 μm. (E): Quantification of ovarian Cyto c staining represents the percentage of immunopositive cells to the total area of the microscopic high power field (20×); was averaged across 6 fields for each rat section of at least three independent experiments. (F): ovarian caspase-3 activity expressed as nmol/ mg protein. Each bar represents the Mean ± SEM for a group of 6 rats. a or b: Statistically significant from control or radiation group, respectively at P<0.05 using one way ANOVA followed by Tukey–Kramer as a post-hoc test.

