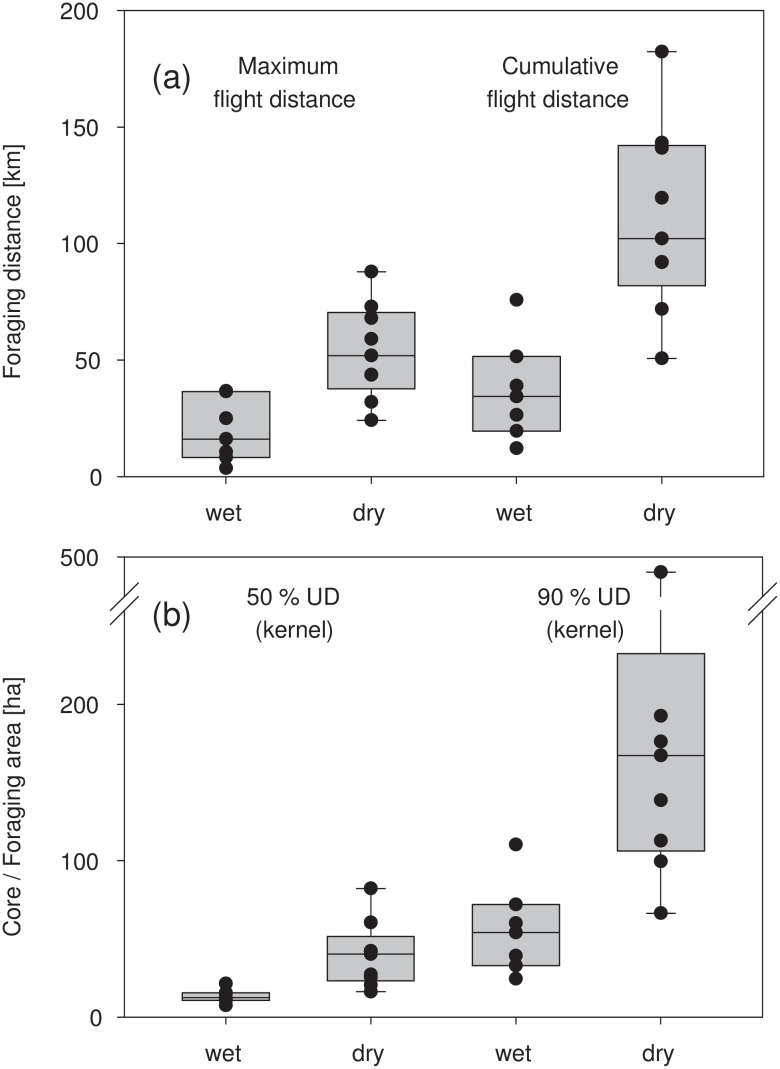
Fig 2. Seasonal changes of maximum and cumulative flight distances (a), and in size of core and foraging areas (b).
Box plots show maximum flight distances from the colony to the most distant foraging area and the mean of daily cumulative flight distances. Box plots of core and foraging areas show the 50% and 90% kernel density UDs (Table 1). Dots represent raw data.

