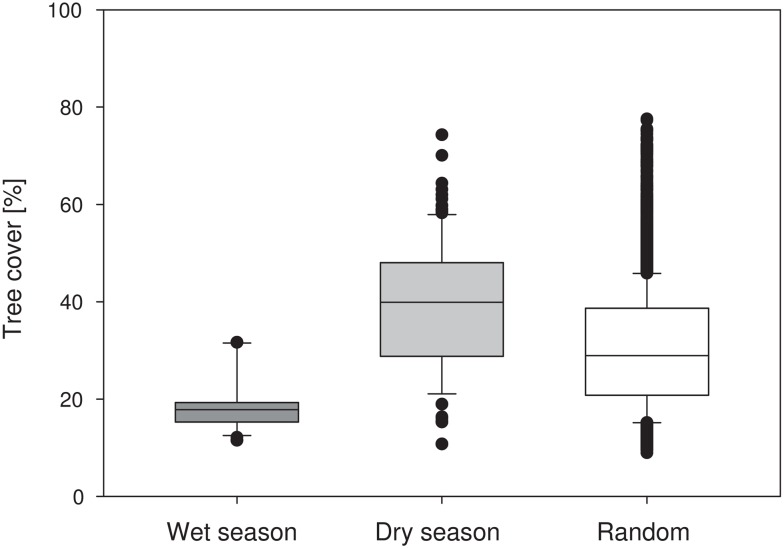
Fig 4. Habitat use of E. helvum with respect to tree cover.
Box plot of foraging points during the wet (n = 306) and dry season (n = 225) compared to the frequency distribution of 10,000 random points within a radius of 88 km around the colony site. Black dots: outliers beyond the 5th / 95th percentiles.

