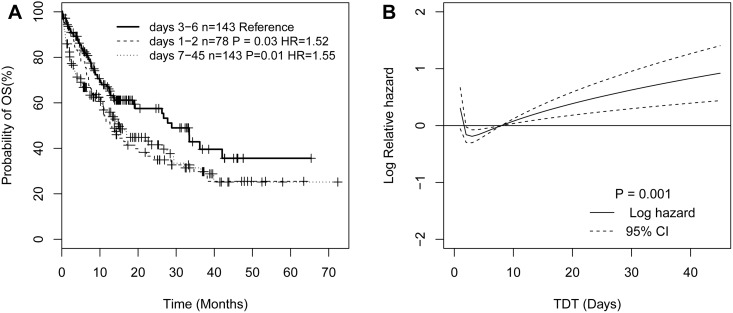
Fig 1. The plots illustrating the nonlinear relationship between TDT and overall survival.
Kaplan–Meier survival curves illustrating the effect of TDT as a categorical variable on overall survival (A). The plot of the estimated log hazard in mortality using fractional polynomial algorithm together with its 95% confidence (B).

