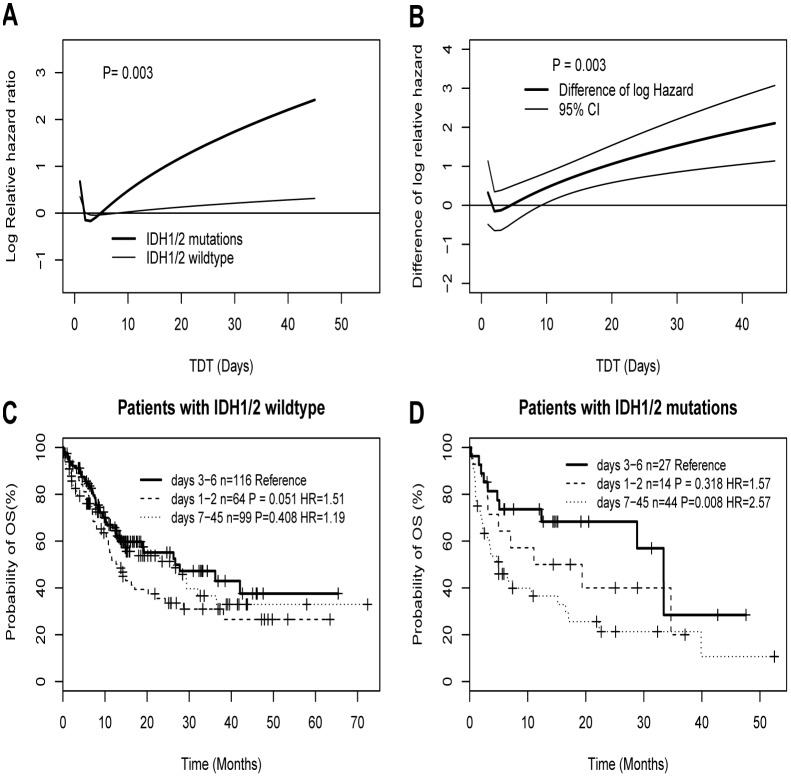
Fig 2. The plots illustrating the interaction between IDH1/2 mutations status and TDT.
Log hazard in mortality for AML patients by IDH1/2 mutation status (A), and estimated difference of log hazard in mortality between IDH1/2 mutations and wildtype together with its 95% confidence band (B). Figure C shows that for patients with IDH1/2 wildtype the survival rates decrease in a similar fashion, whereas Figure D shows IDH1/2 mutant patients with a TDT of 7 days or more have a lower survival rate. MFPIgen function (A) and MFPI function (B) were respectively estimated the interaction effects. Kaplan–Meier survival curves (C and D) illustrating the interaction between TDT and IDH1/2 mutations.

