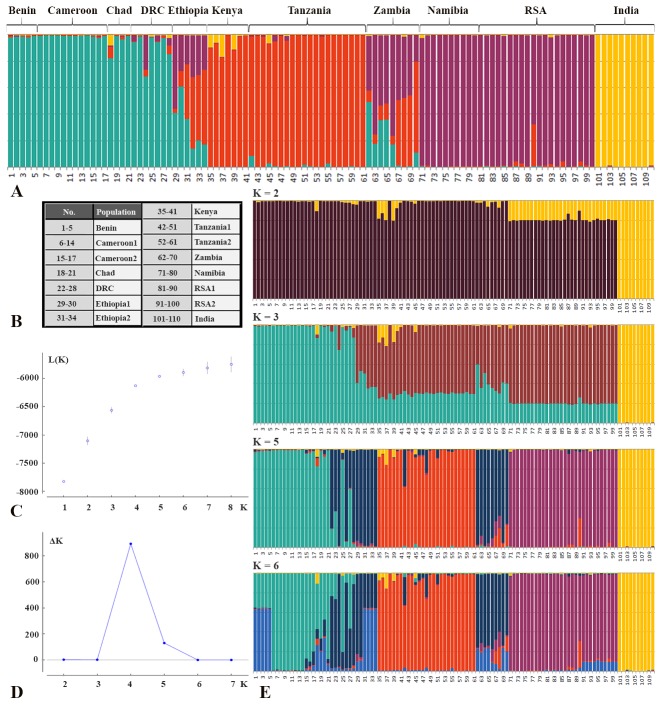
Fig 2. Results of STRUCTURE analysis based on 20 microsatellite loci of 15 lion populations (Dataset 1 + 2 individuals from Ethiopia1).
A: representation of assignment values found by STRUCTURE, using K = 4; B: Overview of included populations; C: Plot indicating mean log likelihood Ln (P(X|K); D: plot indicating ΔK values as a function of the number of genetic clusters (K), in which ΔK = mean(|L”(K)|)/sd(L(K)); E: Representation of assignment values found by STRUCTURE, using K = 2. K = 3, K = 5 and K = 6.

