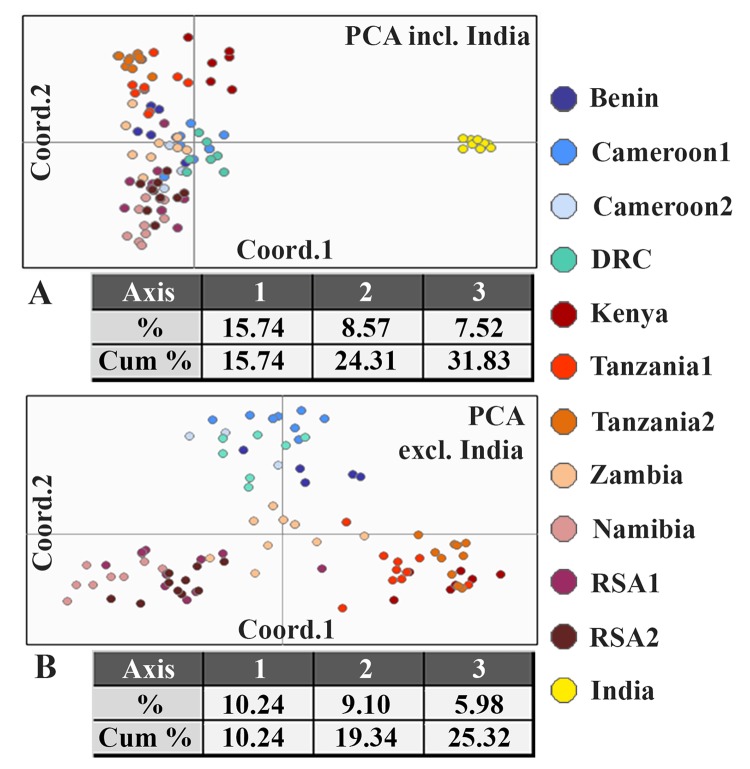
Fig 3. Results of PCA based on 20 microsatellite loci of lion populations.
A: results of PCA of 12 populations (Dataset 1, excluding Chad and Ethiopia2), shown in a two-dimensional plot and a table indicating the percentage and the cumulative percentage explained by the first three axes; B: Results of PCA of 11 populations, excluding India.

