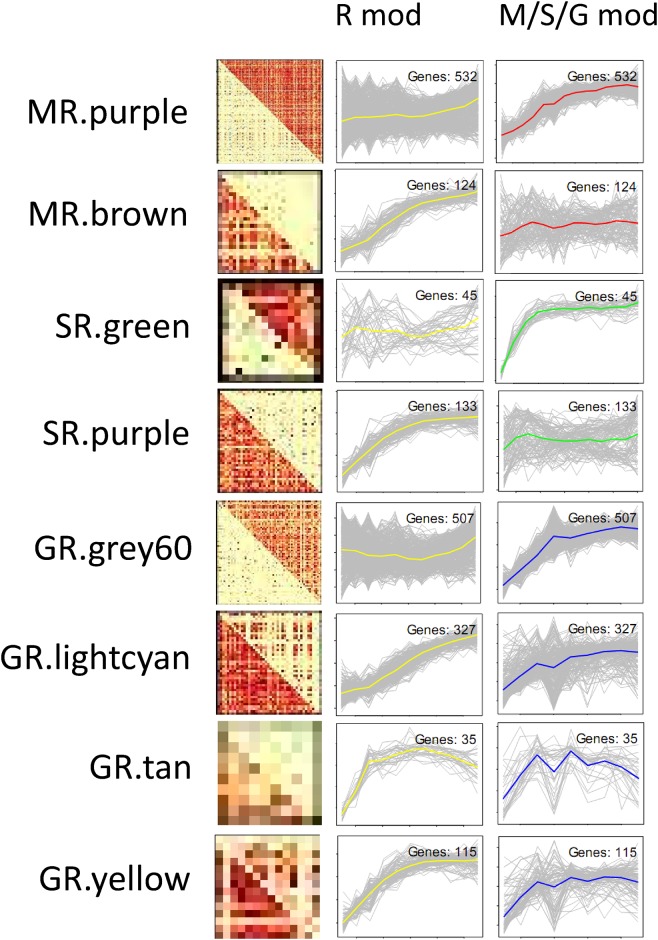
Fig 5. Differential co-expressed photosynthesis enriched modules between rice (R) and C4 species of maize (M), green foxtail (G) and sorghum (S).
The first column represents heatmaps (the red color indicates positive correlations and blue indicates negative) of the modules, the second column (R Mod) indicated the corresponding gene expression profiles in rice; and the third column (M/S/G Mod) represented corresponding gene expression profiles in maize (red line), sorghum (green line) and green foxtail (blue line).

