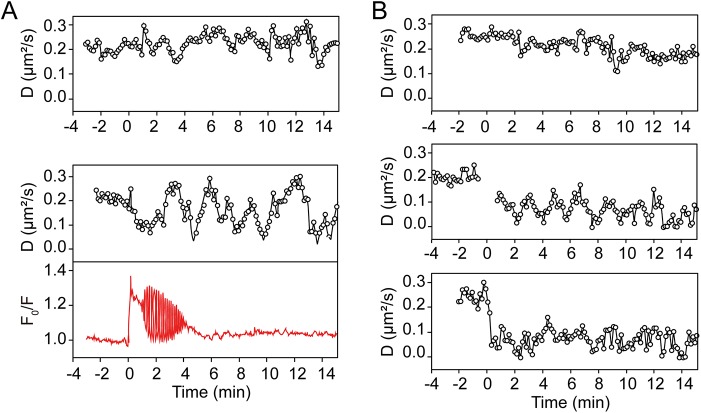
Fig 3. Participation of nPKC and PKD1 in the feedback monomerization of the EGFR.
(A) Time traces of diffusion coefficient of EGFRwt in the presence of the PKC activator PMA (upper) or under nominally Ca2+-free conditions (lower panel). In red, the time trace of cytosolic Ca2+ concentration monitored with Fura Red is shown. (B) Time traces of diffusion coefficient of eGFP-EGFRwt in the cell coexpressing constitutively active mutant, mCherry-PKD1S738/742E (upper), in the cell pre-treated with 10 μM CID755673, PKD1 inhibitor (middle), or in the cell coexpressing kinase deficient mutant, mCherry-PKD1K612W (lower panel).

