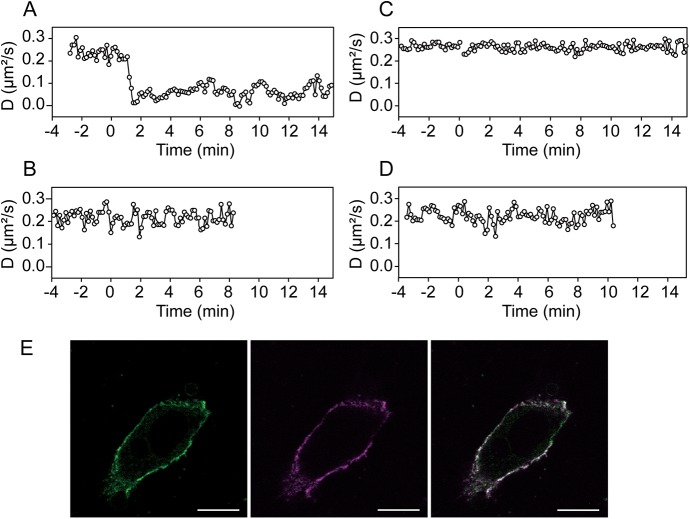
Fig 4. Threonine phosphorylation at JM regions influences the monomer–dimer equilibrium of EGF-bound EGFR.
(A-D) Time traces of the diffusion coefficient of the EGFR with JM region threonine residue mutations; phosphodeficient mutant, EGFRT654/669A (A), three phosphomimic mutants, EGFRT654/669E (B), EGFRT654E (C), and EGFRT669E (D). (E) EGF (Alexa647-labeled, 0.17 μM; magenta) binding to EGFRT654/669E (green) expressing cell. The right panel shows the merged image. Scale bars represent 10 μm.

