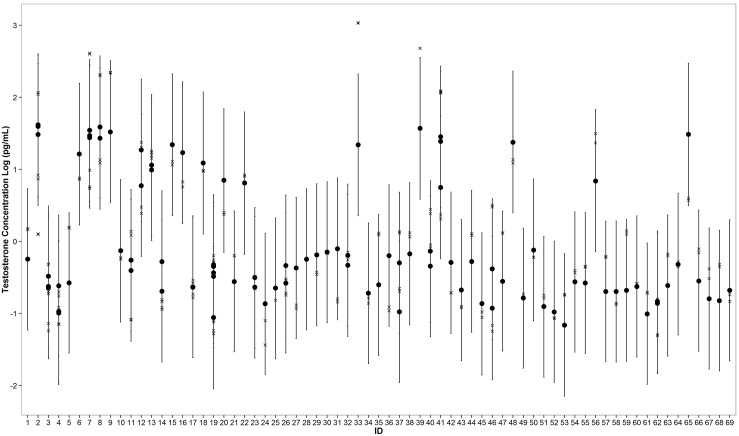
Fig 5. Posterior simulations of mean testosterone concentrations (in the natural logarithm space) for the 96 green sea turtle plasma samples used in this study.
Filled circles indicate medians, vertical lines indicate 95% confidence intervals, and X symbols indicate observed values. Note: some turtles were recaptured and are represented by multiple data points. Three adult male turtles (IDs 7, 33, 39) have values outside of the 95% confidence intervals.

