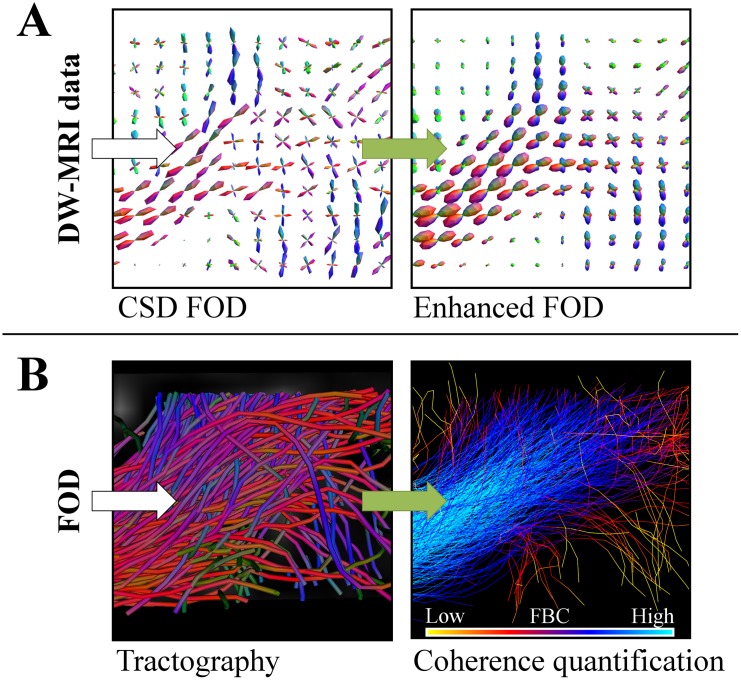
Fig 1. The proposed pipeline of the paper.
CSD is used to estimate an FOD from DW-MRI data. The FOD is enhanced (A) with PDE techniques. Then a deterministic or probabilistic tractography is applied to the (enhanced) FOD (probabilistic shown here, with coloring indicating the fiber direction). In the lower right figure, we applied our coherence quantification method (B), based on the same PDE framework, which shows that blue fibers are well aligned (high Fiber to Bundle Coherence (FBC)) and yellow fibers are spurious (low FBC). The green arrows indicate the steps in which the contextual PDEs are used.

