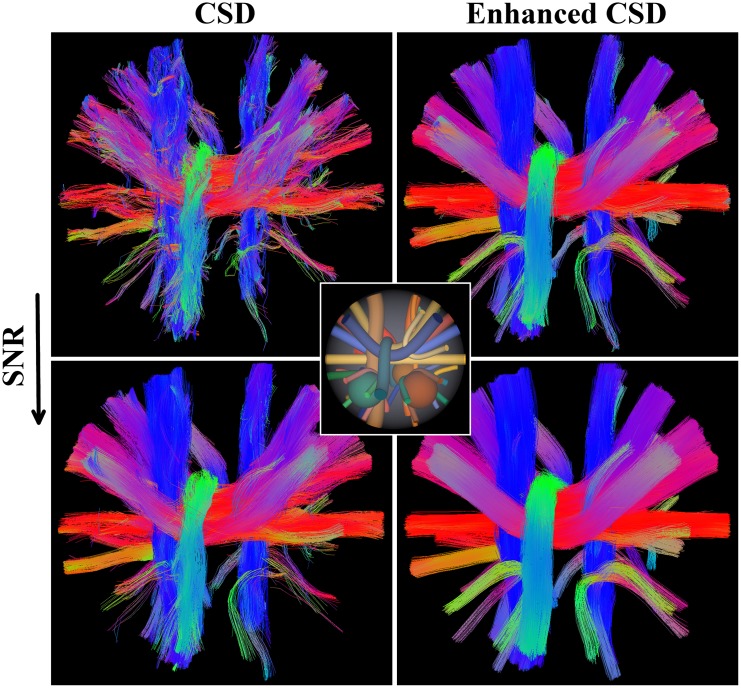
Fig 7. Tractrography results on the ISBI Challenge dataset.
Deterministic tractography results of CSD (left) and enhanced CSD (right) with SNR = 2 (top) and SNR = 4. The colors correspond to the direction of the fibers. The dataset consists of crossing, branching and kissing fiber bundles. The tractography on enhanced CSD results in better aligned fibers and a fuller reconstruction of the bundles. The ground truth configuration of the bundles is depicted in the center.

